Example
The mass is displaced to the left from its equilibrium position
through a small distance d and is released. The mass undergoes
simple harmonic motion.
The graph shows the variation with displacement x from the
equilibrium position of the kinetic energy of the mass.
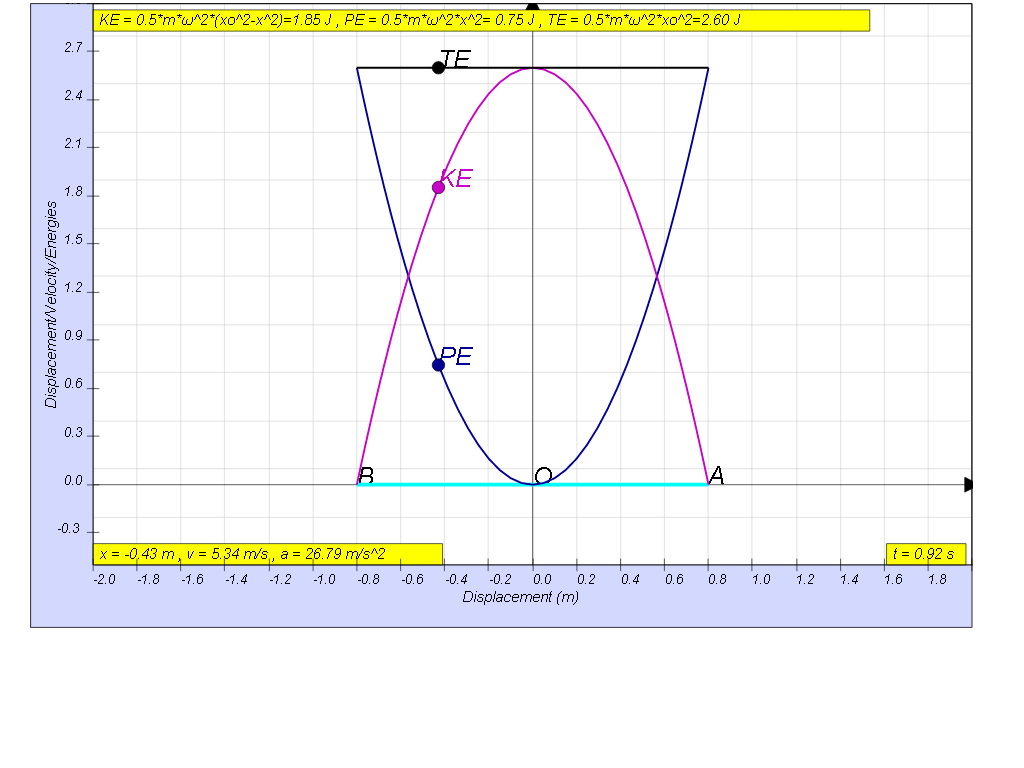
Use the graph to
(a) determine the distance d and the greatest
acceleration through which the mass was displaced initially,
(b) determine the period, frequency and angular
frequency.
(c) determine
the corresponding equations of displacement, velocity and
acceleration.
(d) determine
the corresponding equations of elastic potential energy and the
total mechanical energy and sketch them on the graph above.
(e) determine
the corresponding equations of kinetic energy, potential energy
and total energy
[0.8m, 0.79 s,
1.26 Hz, 7.91 rad/s]
[ x= - 0.8
cos(7.91t), v= 6.32 sin(7.91t), a= 50 cos(7.91t)]
[KE = 2.6 sin
7.912t, PE = 2.6 cos 7.912t, TE =2.6 J]
[KE = 4.06
(0.82-x2), PE = 4.06 x2, TE = 2.6
J]
Using the
model, this graph can be shown
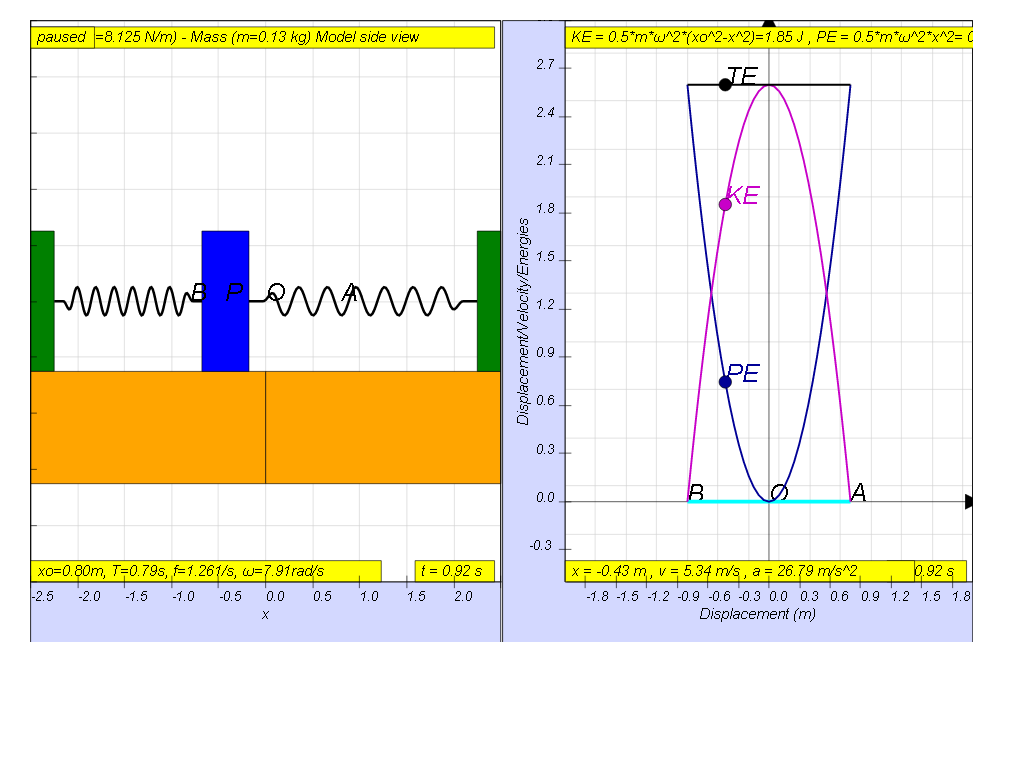 the
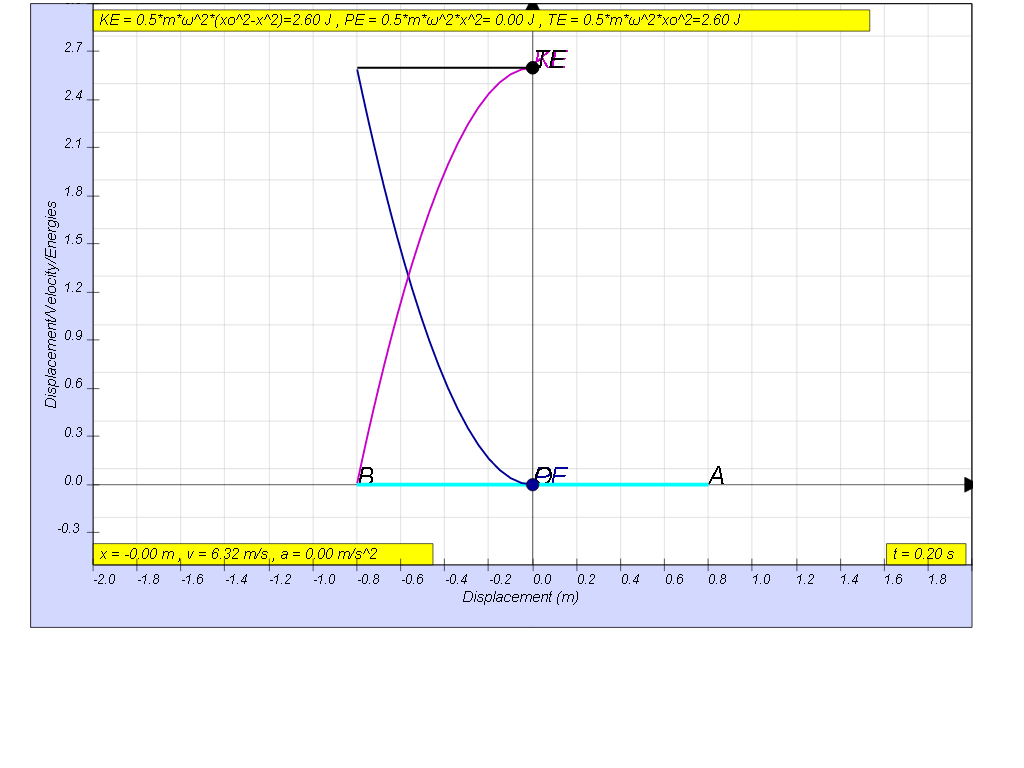
velocity maximum value can be found in the model as well
the
velocity maximum value can be found in the model as well
Model:
http://dl.dropboxusercontent.com/u/44365627/lookangEJSworkspace/export/ejss_model_SHM19/SHM19_Simulation.xhtml