updated 10 july 2014: indeed the Ferrari car's black box report
data was 168 km/hr matches the accelerating
model A: x = 2.137E1*t^2+3.283E1*t-5.251E-2
 |
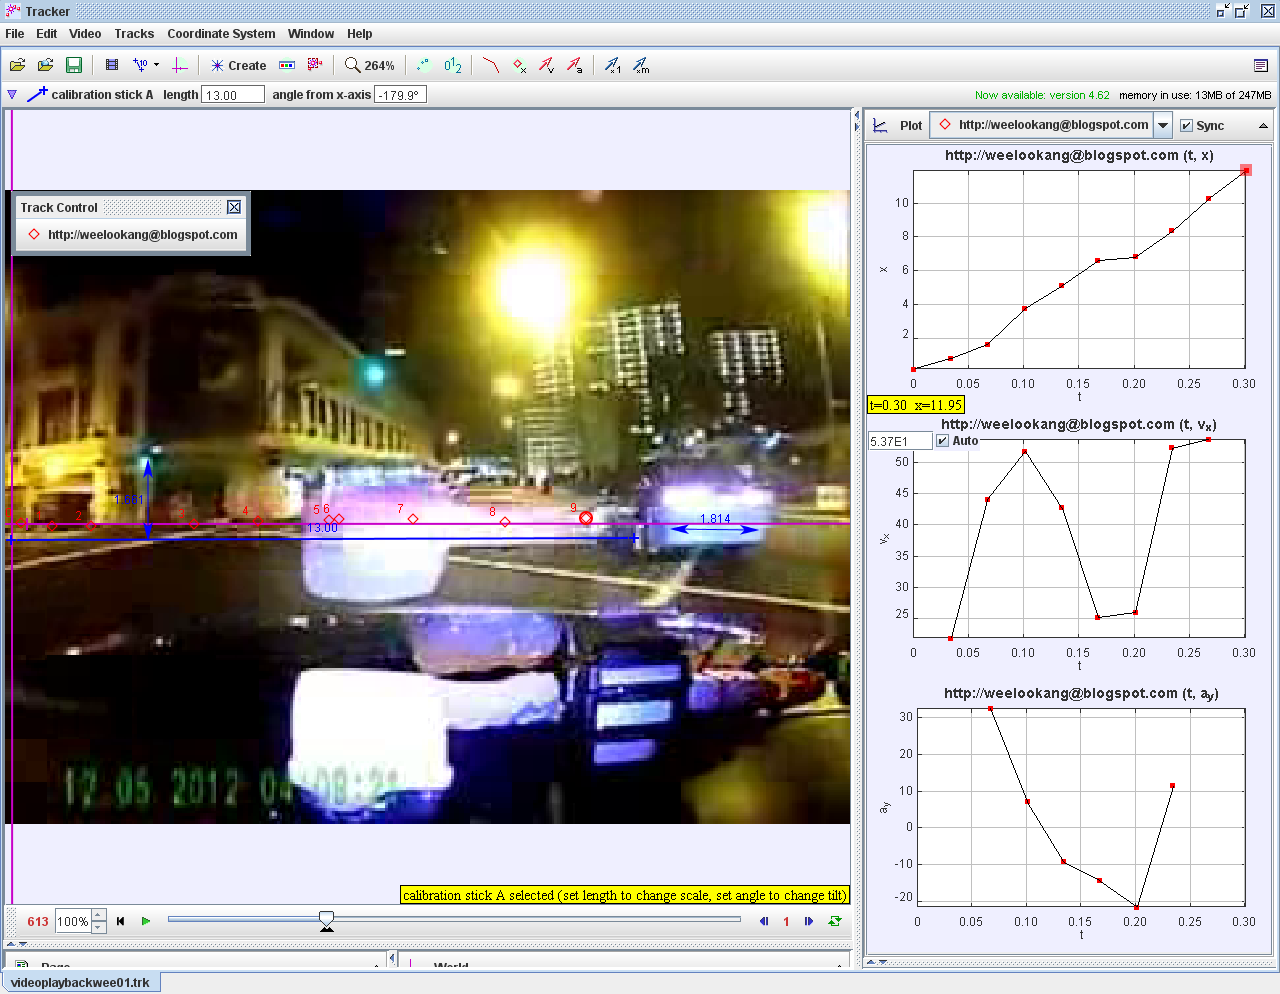
| http://weelookang.blogspot.sg/2012/05/what-evidence-of-speed-ferrari-was.html updated with inputs on length of FERRARI car travel to be 13.0± 1 m with table of data showing 9 frames ending at time t = 0.30 s model accelerating model A: x = 2.137E1*t^2+3.283E1*t-5.251E-2 model constant velocity B: x = 3.925E1*t-3.380E-1 |
 |
| hint for model A: model accelerating model A: x = 2.137E1*t^2+3.283E1*t-5.251E-2 |
 |
| hint for model B: B: x = 3.925E1*t-3.380E-1 |
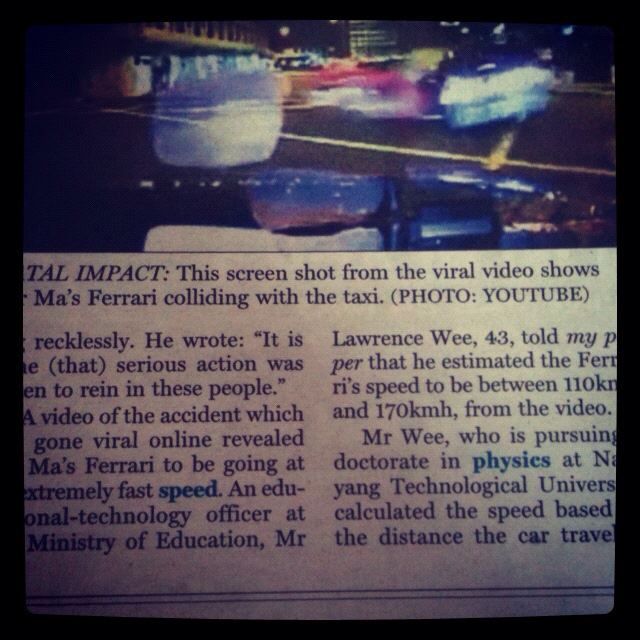
Ferrari 599 GTO crashed a Taxi causing 3 dead, 2 injured in Bugis S'pore - 12May2012
 |
| http://weelookang.blogspot.sg/2012/05/what-evidence-of-speed-ferrari-was.html updated with inputs on length of FERRARI car travel to be 13.0± 1 m with table of data showing 9 frames ending at time t = 0.30 s https://dl.dropbox.com/u/44365627/TrackerDigitalLibrarySG/TrackerFerrari/ferrari.trz |
 |
| updated with inputs on length of FERRARI car travel to be 13.0± 1 m instead of the older assumption of 10 m |
 |
|||
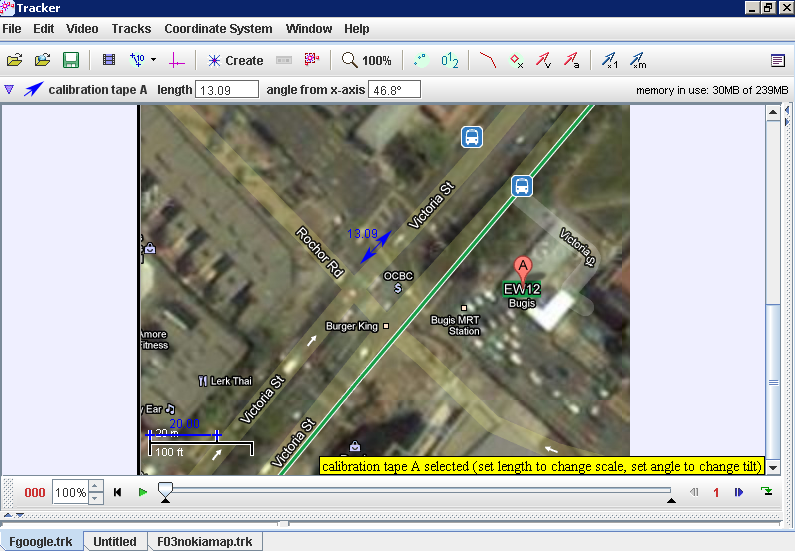
| using Google map to locate and make sense of the actual video scene, a bit of an attempt to measure the distance on the map but the length is too small for accurate distance measurement of 10 m |
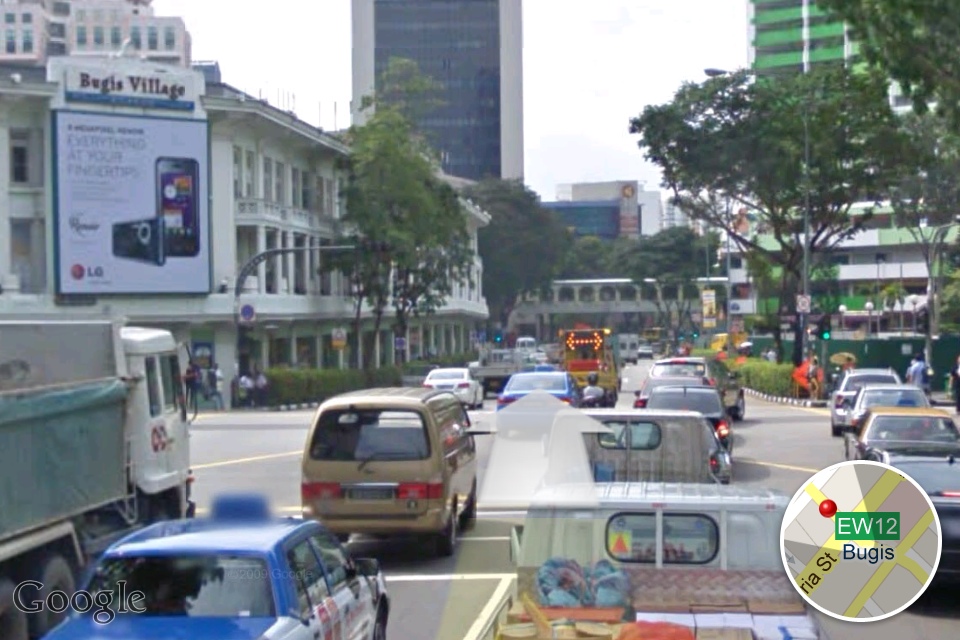 |
| Google map street view from the taxi camera position |
Analysis
using a video found
here http://www.youtube.com/watch?v=S80bDrxrCiI&feature=related
Step1: use any YouTube
down-loader such as this http://downloadyoutubevideo.org/download.php?url=http%3A%2F%2Fwww.youtube.com%2Fwatch%3Fv%3DS80bDrxrCiI%26feature%3Drelated.
But this may result in a video that is frame-frame at 30, though
the answer don't not change.
alternatively,
you can use your iOS phone to
download the video in a *.mp4 which is frame-rate at 25, which
some people have emailed me to ask me, but the final
answer is still the same.
Step 2: save the video into
the computer
Step 3: use tracker http://www.cabrillo.edu/~dbrown/tracker/ to open the video
file, recommended to install on your computer.
 |
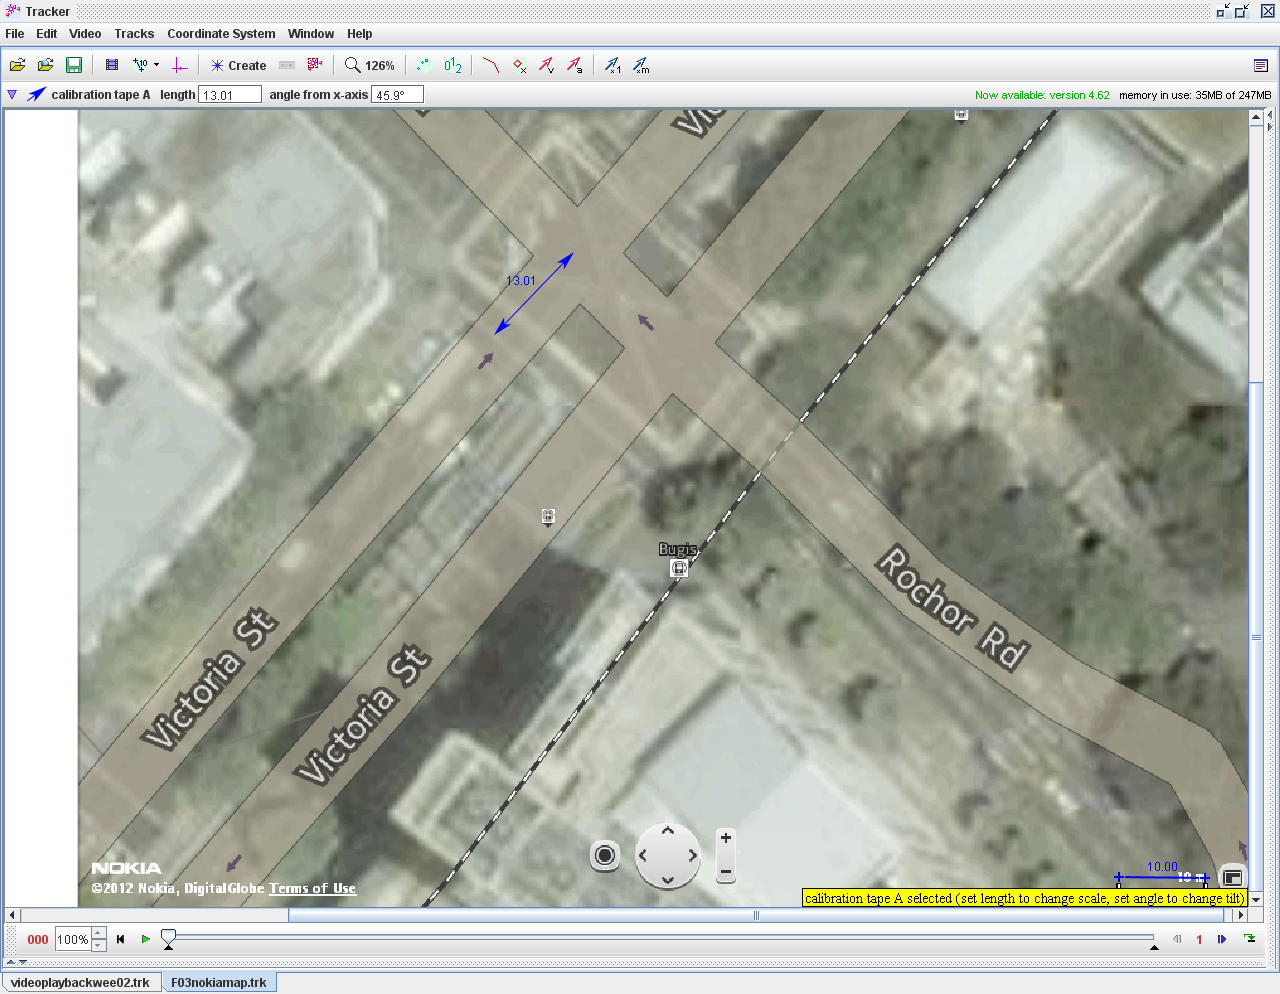
| new estimates of length of car travel in video is now 13.0 ± 1 m , still the cab bumper can be fitted by 1.81 m length |
reason for readjusting the length of car
traveled, results from a discussion with physics
education expert D, Wong who suggested using nokia maps
to estimate the length of car in the video
( we measure from 2 white line of the pedestrian walking to
the center of the junction box. )
 |
|
to estimate the length of car in
the video ( we measure from 2 white line of
the pedestrian walking
to the center of the junction box. ) show
about 13 ± 1 m,
against the map scale on the bottom right 10 m
|
 |
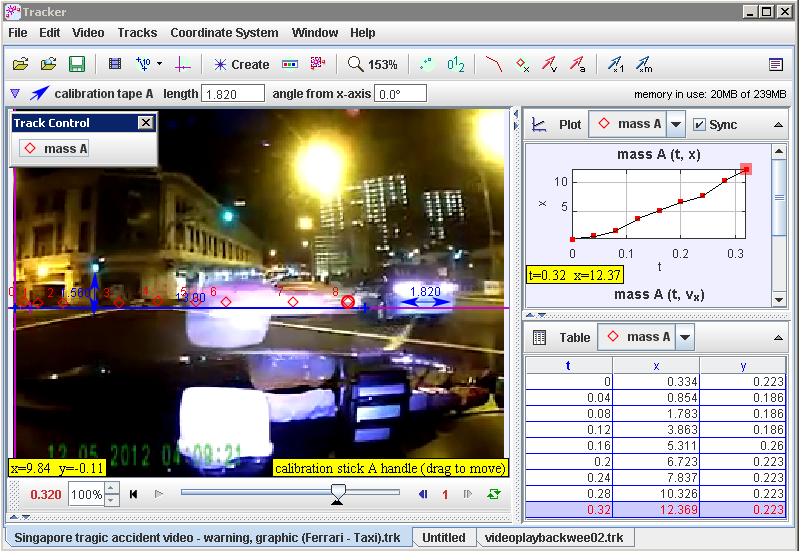
| using tracker, the measurement of length is done easily using calibration tape (length to be measured) and stick (10m) |
even after some prompting by others physics
experts to use Google map to calibrate the length this is what
i found.
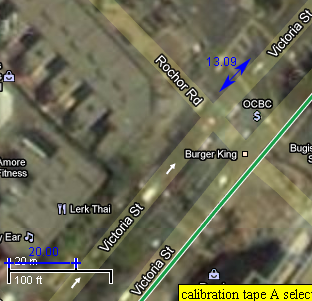 |
| Google map this time, again the length from 2 white line to centre of junction box is about 13 m |
 |
| use tracker to measure length |
Step 4 :state
assumptions made:
- taxi camera is stationary for the duration of the 0.3 seconds the Ferrari sped across
the height of the traffic light post is approximately 2.0 m from base to green light center- distance
traveled by car is roughly 13 ± 1
10m and bumper of taxi is roughly 1.8 m (see diagram) - the video is properly time-frame as 30 frame/seconds as default in the video data, and read correctly by tracker.
- the Ferrari is traveling at constant acceleration = 0 m/s^2track the front of the Ferrari.
Step 5: calibrate pixels in
video with known lengths, improved strategy after discussion on
Facebook distance traveled by car is roughly 13 ± 1 10 m
and bumper of taxi is roughly 1.8 m.
Step 6: Make roughly 8 to 9
points as shown
 |
| Make roughly 8 to 9 points as shown |
even if you use a video with
a frame rate of 25, the answer is still quite the same.
 |
|
| notice in this video the frame rate is 25, because it is a *.mp4 taken from my iOS, the number of points is now 8 instead of 9 from frame-rate 30, making the time still 0.32 instead of 0.3 |
Step 7: .Analyze the
speed
7.1 s vs t
graph, which is roughly 39.23 m/s from
as evidence from the
 |
| linear fit x = 39.231*t + -0.352 where a = 39.231 which means the average velocity assuming a constant velocity motion |
7.2 v vs t graph
statistic mean v average = 39.75
30(wrong estimate) 60 (wrong
estimate) m/s
 |
| data tool notice the mean for x is 3.975E1 which means 39.75, another evidence of average velocity |
average it out =
(39.231+39.75)/2 = 39.5 m/s
Error Analysis:


error analysis suggests,


using estimates of


v = 140 m/s
therefore,
Conclusion:
when converted to km/hr, v =
39.5*3600/1000 = 142 km/hr ≈ 140 ± 30 km/hr ( follow the
order of magnitude of the error)
Claim:
The vehicle is likely to
be traveling at speed of 140± 30 (current best estimate, as
of 17May2012)
Question:
What do you think ??
Source of errors:
- moving source camera and some parallax error taxi camera was not stationary for the duration of the 0.3 seconds the Ferrari sped across.
- the distance 13.0 m traveled by the car may not be corrected measure, thus, a Nokia map was used to check, also cross check with a Google map.
the height of the traffic light post is not 2.0 m from base to green light center- the source of the video could not be verified in the time frame used to capture the video, and the time-framemay not be 30 frame/seconds, though it is likely to be correct. even for 25 frame-rate for *.mp4 files, the answer for (8 pointers) t = 0.32 s would be about the same as (9 pointers) t = 0.3 s for frame-rate 30.
Physics & Science lesson learn could be:
- Using current affairs to educate the children on everyday physics and making physics relevant.
- using evidences to justify claim.
- science knowledge is socially constructed with newer evidences suggesting better ways of explaining the phenomena.
Moral lessons caught could be:
- Don't drive recklessly.
- Don't beat red lights.
- Be responsible
Open Content Sharing of
Educational resources creative commons attribution:
the video, trk files are
downloadable at NTNU java Forum http://www.phy.ntnu.edu.tw/ntnujava/index.php?topic=2447.0 , available to
registered users of the forum, registration is FREE.
Disclaimer:
This post is
made with the best intentions to share good active learning
practices in physics education, any offenses taken please
leave a comment, i will amend the post or/and to remove
offensive content if any.
The mass media media corp 5
news also reported on the accident.
there are other estimates
that may interest you
- http://www.post1.net/lowem/entry/singapore_bugis_ferrari_crash_speed_estimate
- http://forums.hardwarezone.com.sg/eat-drink-man-woman-16/%5Bgpgt%5D-what-do-you-think-ferraris-speed-3729674.html
other links on this post:
- http://singaporeseen.stomp.com.sg/stomp/sgseen/this_urban_jungle/1109242/ferrari_crash_physics_teacher_calculates.html updated to 140 km/h from an earlier underestimation, thanks Stomp!
- http://motoring.asiaone.com/Motoring/News/Story/A1Story20120517-346558.html by dassa@sph.com.sg
- http://news.asiaone.com/News/Latest%2BNews/Singapore/Story/A1Story20120518-346624.html byethanlou@sph.com.sg
- my ex-student's T Wee Facebook photo https://fbcdn-sphotos-a.akamaihd.net/hphotos-ak-snc7/576540_10150978291483223_784348222_11692069_1677107363_n.jpg
 |
| my ex-student T Wee's Facebook photo https://fbcdn-sphotos-a.akamaihd.net/hphotos-ak-snc7/576540_10150978291483223_784348222_11692069_1677107363_n.jpg |
 |
| SMS by ex-student T Wee, thanks! |
- http://www.edvantage.com.sg/edvantage/news/news/1110736/Ferrari_was_travelling_at_140kmh_ex_physics_teacher.html
- Power 98 DeeJay mention on 18 May 2012 at 810 am.