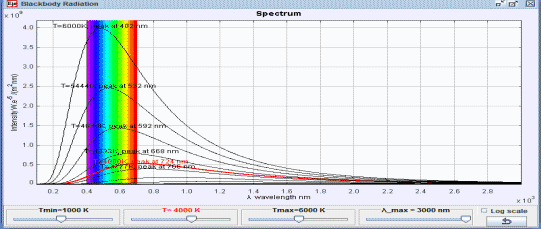

The Blackbody Radiation Spectrum model shows six fixed-temperature curves between Tmin and Tmax and a red variable-temperature curve that can be adjusted using a slider. The wavelength is measured in nm (nanometer) and the intensity is measured in W.e-5 / (m2.nm). Users can adjust Tmin and Tmax to change the temperature range that is displayed.
The Blackbody Radiation Spectrum model was created by created by Fu-Kwun Hwang, customized by Loo Kang WEE, and edited by Wolfgang Christian using the Easy Java Simulations (EJS) version 4.2 authoring and modeling tool. An applet version of this model is available on the NTNU website < http://www.phy.ntnu.edu.tw/ntnujava/ >.
You can examine and modify this compiled EJS model if you run the model (double click on the model's jar file), right-click within a plot, and select "Open EJS Model" from the pop-up menu. You must, of course, have EJS installed on your computer. Information about EJS is available at: <http://www.um.es/fem/Ejs/> and in the OSP comPADRE collection <http://www.compadre.org/OSP/>.