Breadcrumbs


Download ModelDownload Sourceembed

Translations

Code Language Translator Run

Software Requirements

SoftwareRequirements


Android iOS Windows MacOS
with best with Chrome Chrome Chrome Chrome
support full-screen? Yes. Chrome/Opera No. Firefox/ Samsung Internet Not yet Yes Yes
cannot work on some mobile browser that don't understand JavaScript such as.....
cannot work on Internet Explorer 9 and below


Credits

Francisco Esquembre; Felix J. Garcia Clemente; This email address is being protected from spambots. You need JavaScript enabled to view it.; Rena F; Zed; ShiXiong (idea); fazli1702

end faq


Sample Learning Goals

https://vle.learning.moe.edu.sg/mrv/community-gallery/lesson/view/15604d4a-3ad7-43ce-acb0-a9287d572f58/cover

This lesson deepens students' understanding of factors affecting the rate of evaporation. 

  • Pri 5 & 6 SCIENCE (2014) (2014)

For Teachers Request from ETD and Woodgrove Primary

Email from ETD folks together with Woodgrove Primary. 

These are the requests from the school, please let me know if it is possible:

  1. We do not want students to have the option to toggle the display to show the graph, so fixing it to only this view will be good.
  2. As we are using this for primary school context, we will prefer that the side profile of the container is rectangular.
  3. We would like the red dotted line to be removed as it may be confusing for students as the intent is to use this for data collection.
  4. As students will be collecting information on the time taken for all the water to evaporate, we will need the time lapsed to be shown on the interface.
  5. For the temperature slider, we need it to move by steps of 1 degree Celsius and have a range of 1 to 40 degrees Celsius.

Thank you so much!


Title: The Importance of Customization in Virtual Laboratories for Enhanced Student Learning

Introduction:

Virtual laboratories have emerged as powerful educational tools that offer students a hands-on experience in a digital environment. To further enhance the student learning experience, customization plays a crucial role. In response to the specific requests from a primary school, this blog post will explore why customization of simulations is key to improving the student learning experience with virtual laboratories.

1. Fixed Display Option:

By fixing the display to show only the graph, students are encouraged to focus on the essential data representation. Removing the option to toggle the display ensures that students direct their attention to the graph, allowing for a more focused and streamlined learning experience.

removed the combo box for the display
 

2. Tailoring Container Design:

In a primary school context, it is important to consider the familiarity of objects and concepts. Customizing the side profile of the container to a rectangular shape aligns with students' existing knowledge and promotes a clearer understanding of the laboratory setup. This customization bridges the gap between the virtual and physical worlds, making the learning experience more relatable for young learners.

changed the shape to allow rectangle only 


changed the shape to allow rectangle only 


3. Eliminating Confusion:

The removal of the red dotted line addresses the potential confusion it may cause during data collection. By simplifying the interface, students can concentrate on gathering data related to their experiment's main objective, such as tracking the time taken for water to evaporate. Minimizing unnecessary visual elements reduces cognitive load and ensures a more intuitive learning experience.

4. Time Lapsed Display:

To support the collection of accurate data, the virtual laboratory interface should include the display of time lapsed. By incorporating this feature, students can precisely record and analyze the time taken for water evaporation. This customization facilitates data-driven learning and empowers students to make connections between time and the evaporation process.

after clicking store ▼ data (arrow down)
with added stopwatch and table of data for ease of data collection


with added stopwatch and table of data for ease of data collection


5. Fine-Tuned Temperature Slider:

For precise experimentation, customization of the temperature slider is essential. By enabling the slider to move in 1-degree Celsius increments within a range of 1 to 40 degrees Celsius, students gain granular control over the simulation parameters. This customization allows for detailed exploration of the relationship between temperature and the rate of evaporation, fostering a deeper understanding of the underlying scientific principles.


Conclusion:

Customization of virtual laboratory simulations plays a pivotal role in enhancing the student learning experience. By adhering to the requests from the school, such as fixing the display, tailoring container design, eliminating confusion, displaying time lapsed, and fine-tuning the temperature slider, we create a tailored educational environment that aligns with the needs and goals of primary school students. Through these customizations, virtual laboratories become powerful tools that promote engagement, understanding, and a love for scientific exploration among young learners.

For Teachers

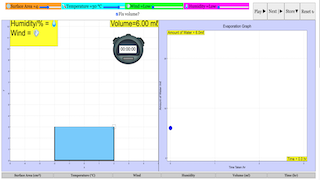
Evaporation (Surface Area, Temperature, Humidity, Presence of Wind) for Primary School


For a small surface area, the rate of evaporation of water in the container decreases with time
https://iwant2study.org/ospsg/index.php/968
Direct Link
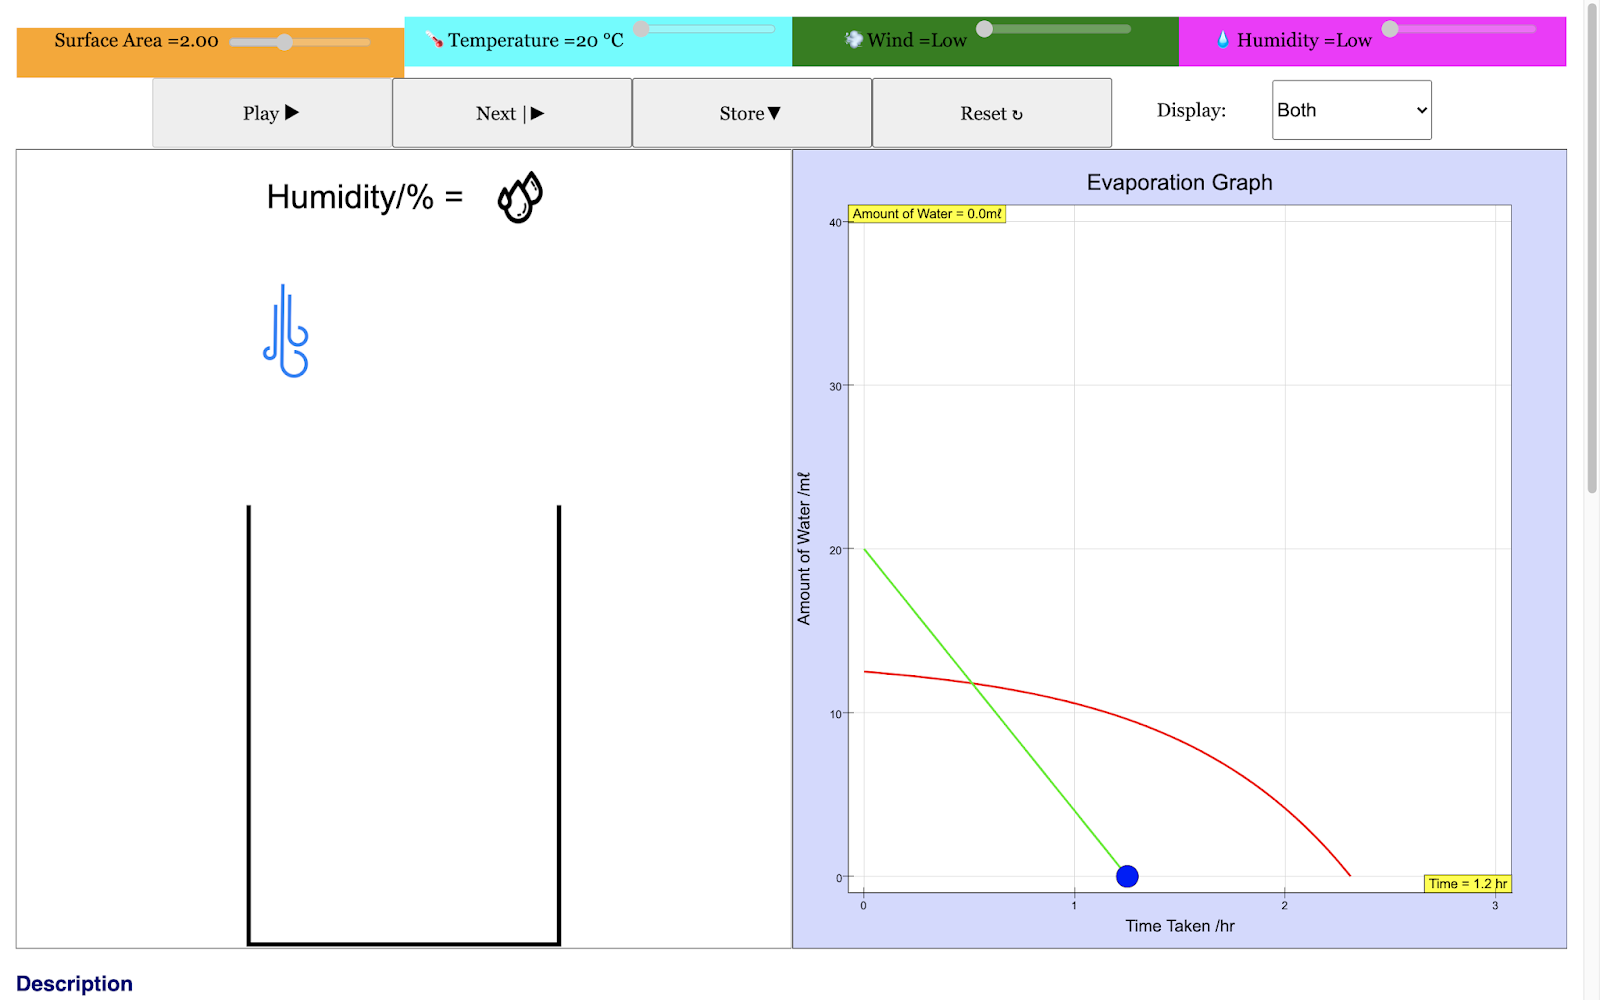
For a middle size surface area, the rate of evaporation of water in the container decreases with time linearly as the surface is constant
https://iwant2study.org/ospsg/index.php/968
Direct Link
For a large surface area at the beginning, the rate of evaporation of water in the container decreases with time in the blue trail
This implies larger the surface area the shorter the time taken to evaporate
https://iwant2study.org/ospsg/index.php/968
Direct Link


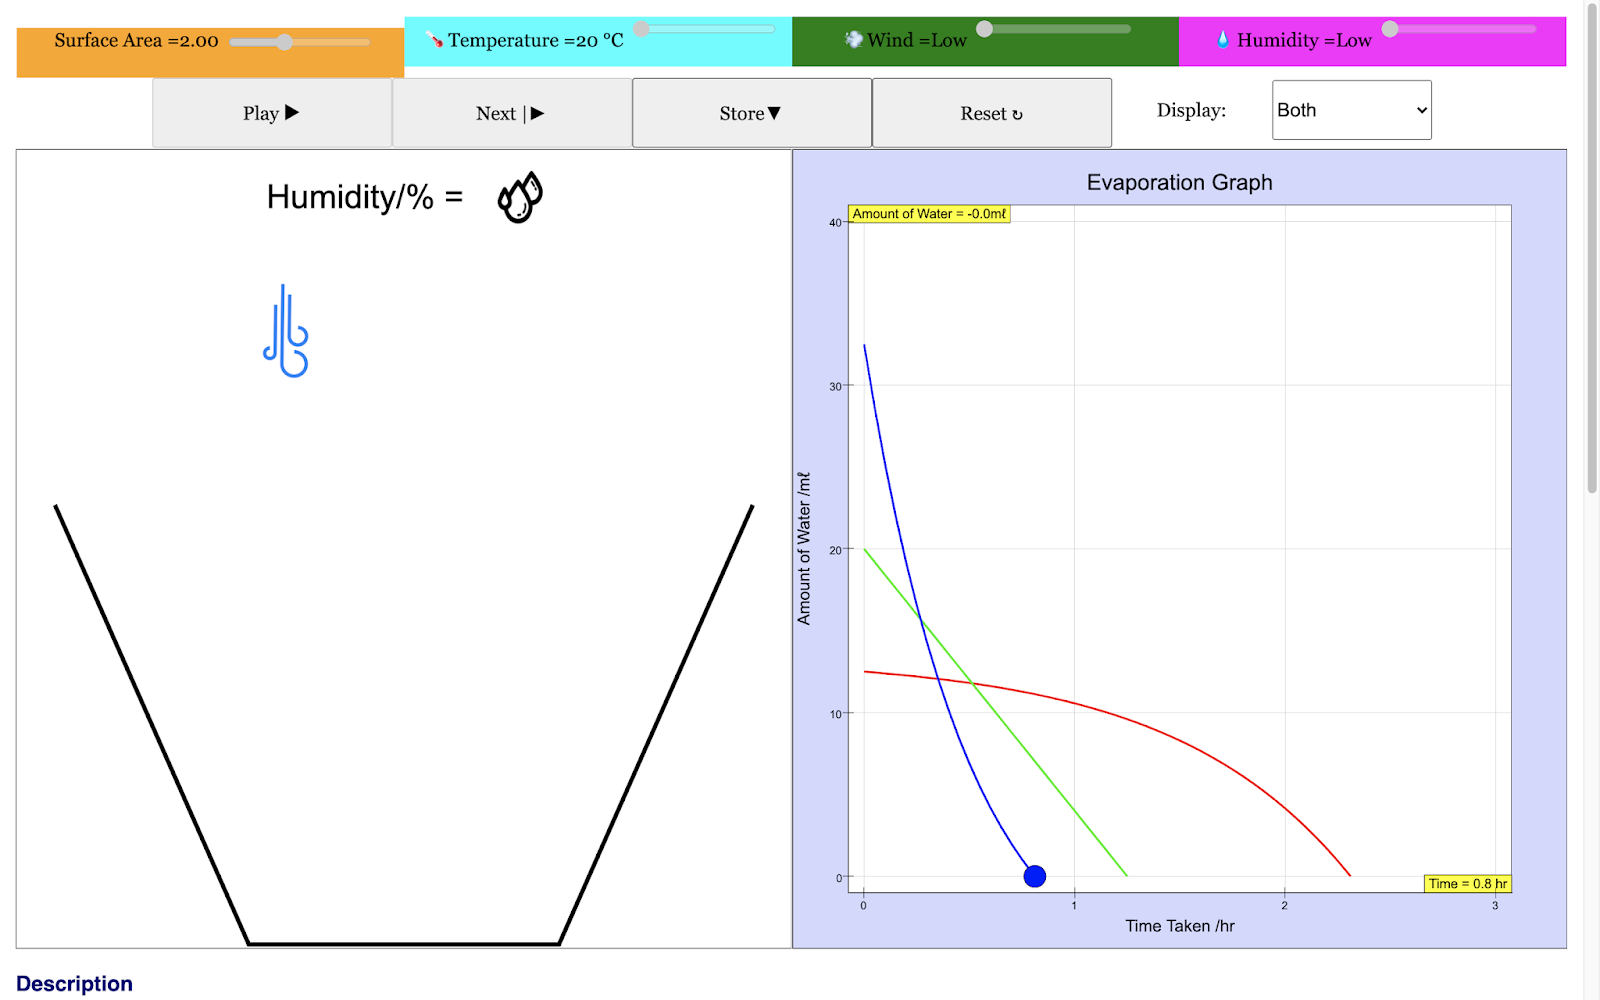
For a low temperature, the rate of evaporation of water in the container decreases with time linearly in the red trail
https://iwant2study.org/ospsg/index.php/968
Direct Link
For a middle temperature, the rate of evaporation of water in the container decreases with time linearly in the green trail
https://iwant2study.org/ospsg/index.php/968
Direct Link

For a high temperature, the rate of evaporation of water in the container decreases with time linearly in the blue trail.
This implies higher the surrounding temperature the shorter the time taken to evaporate
https://iwant2study.org/ospsg/index.php/968
Direct Link

For a low wind condition, the rate of evaporation of water in the container decreases with time linearly in the red trail
https://iwant2study.org/ospsg/index.php/968
Direct Link

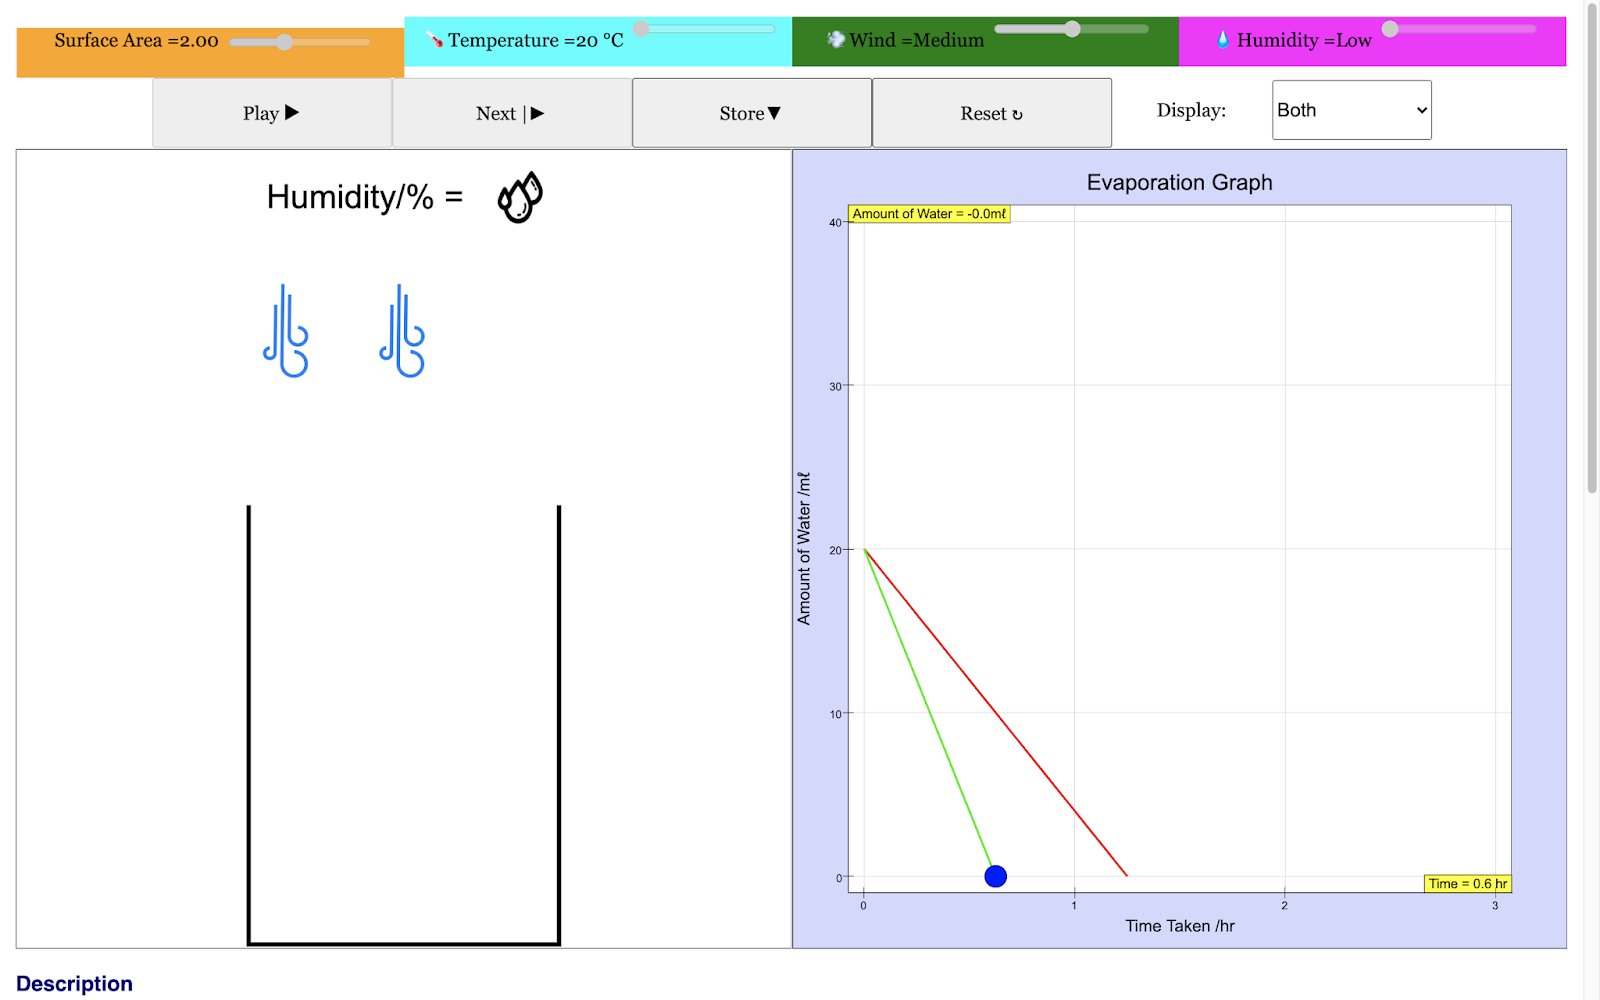
For a medium wind condition, the rate of evaporation of water in the container decreases with time linearly in the green trail
https://iwant2study.org/ospsg/index.php/968
Direct Link
For a high wind condition, the rate of evaporation of water in the container decreases with time linearly in the blue trail
This implies higher the wind the shorter the time taken to evaporate
https://iwant2study.org/ospsg/index.php/968
Direct Link


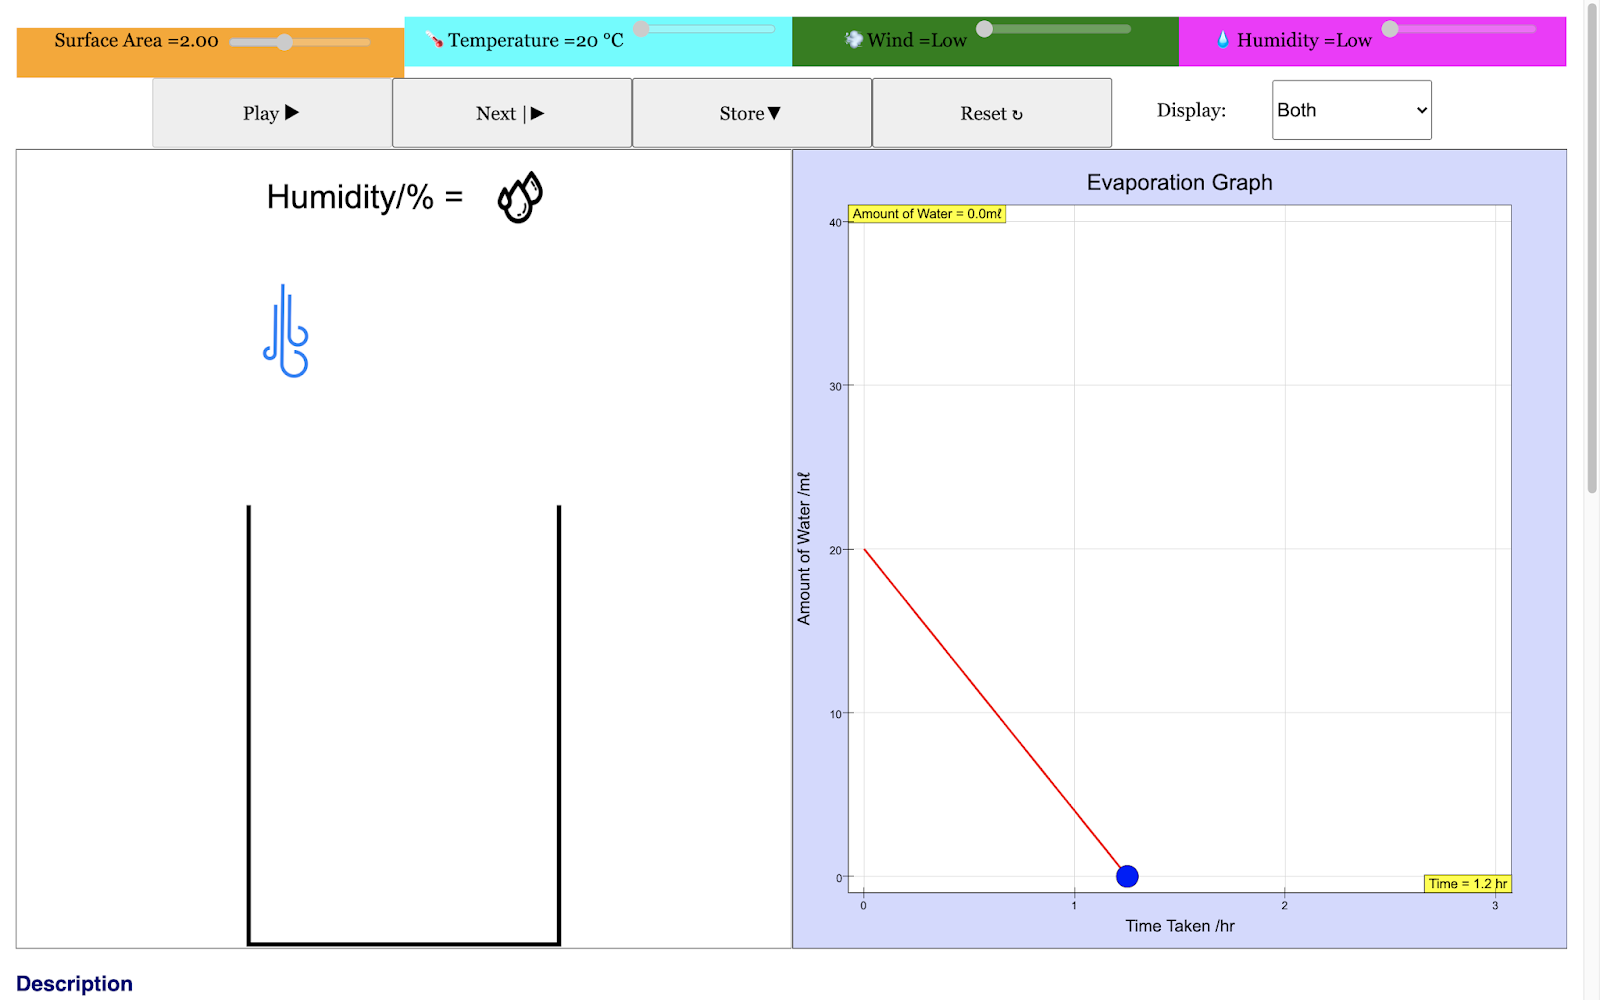
For a low humidity condition, the rate of evaporation of water in the container decreases with time linearly in the red trail
https://iwant2study.org/ospsg/index.php/968
Direct Link
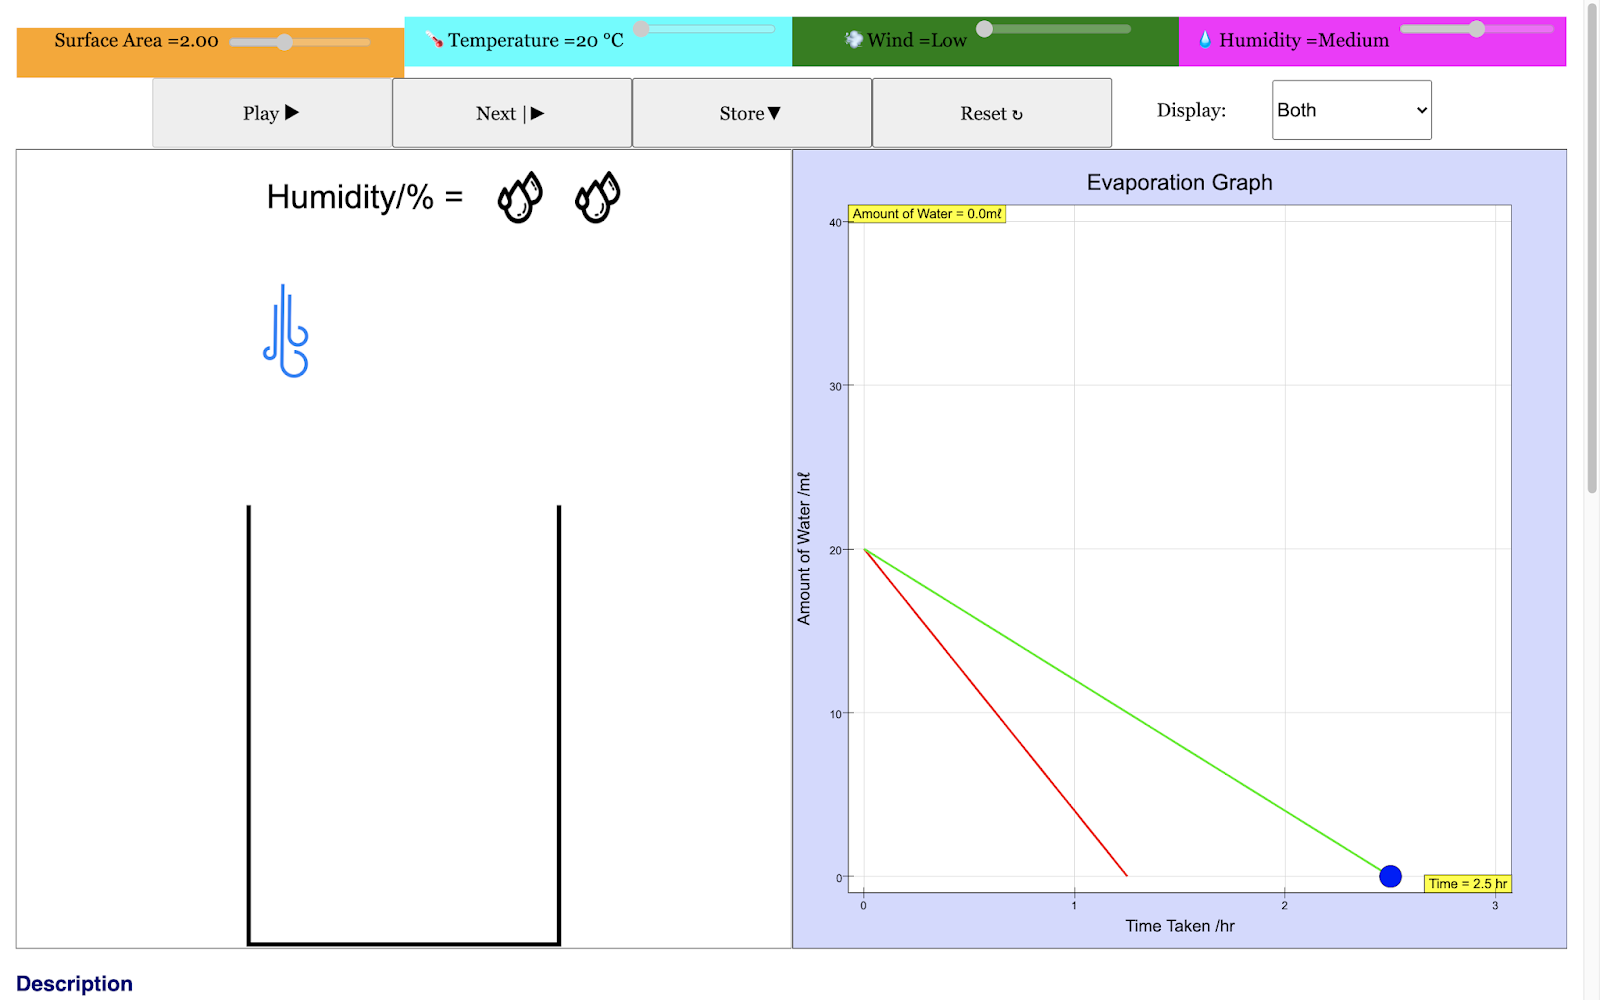
For a medium humidity condition, the rate of evaporation of water in the container decreases with time linearly in the green trail
https://iwant2study.org/ospsg/index.php/968
Direct Link

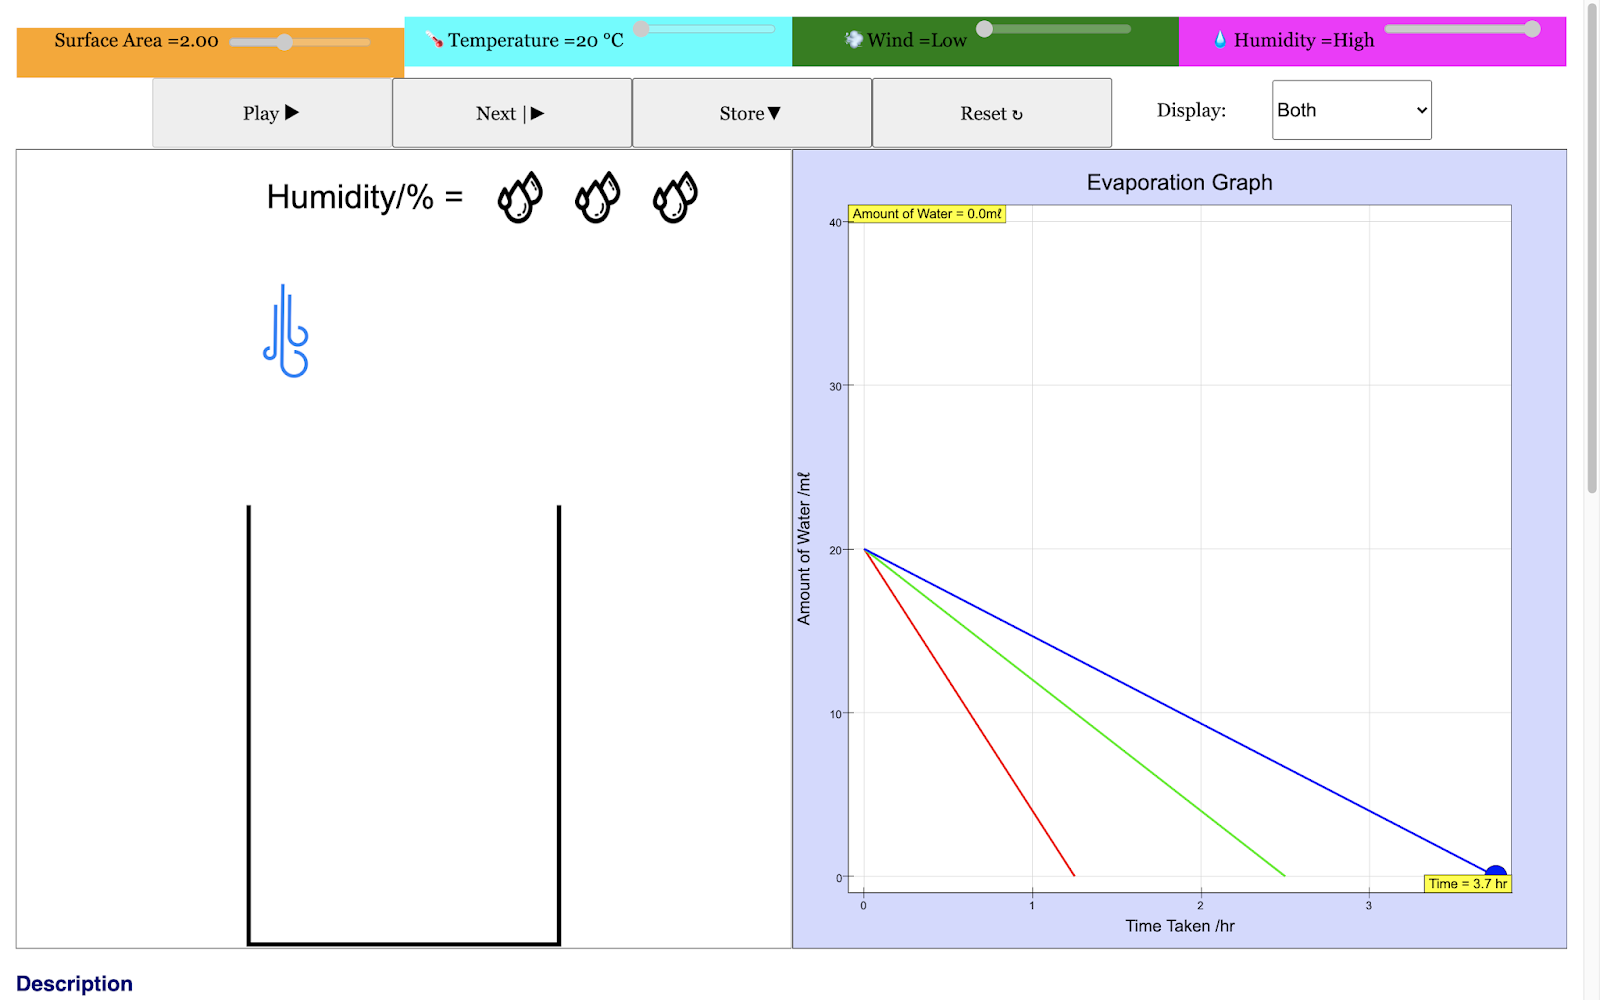
For a high humidity condition, the rate of evaporation of water in the container decreases with time linearly in the blue trail
This implies higher the humidity the longer the time taken to evaporate
https://iwant2study.org/ospsg/index.php/968
Direct Link


Research

[text]

Video


https://www.youtube.com/watch?v=4JIz7913EQU 

Experiment 1

Change the temperature to 30 ◦c

Click play to see a graph appears

Click store to save the graph at 30 ◦c

Look at the time taken when the amount of water left in the container is zero.

Record the hours the water takes to evaporate.

Change the temperature to 20 ◦c

Record the hours the water takes to evaporate

Study the 2 graphs to compare the rate of evaporation of water.

Which temperature causes the water to evaporate faster?


Evaporation due to surface area, humidity and wind virtual labs for primary school science

 Version:

  1. http://weelookang.blogspot.com/2020/06/evaporation-surface-area-temperature.html
  2. https://weelookang.blogspot.com/2022/02/evaporation-surface-area-temperature.html
  3. https://weelookang.blogspot.com/2023/05/request-from-woodgrove-primary-on.html

Other Resources

https://vle.learning.moe.edu.sg/moe-library/lesson/view/fa3ded3e-8253-418c-b183-5bfd2e316d20?fromCcpm=false

https://vle.learning.moe.edu.sg/moe-library/lesson/view/d2d36336-8fe8-4eb7-bb69-8d813e5a429b?fromCcpm=false

end faq

1 1 1 1 1 1 1 1 1 1 Rating 0.00 (0 Votes)