Teacher Demonstration
Use the live model as a shared screen demonstration before students try their own predictions and observations.
Analyse Very Hard Push as a Tracker video-analysis activity for kinematics, using calibrated video points and graphs to describe motion.
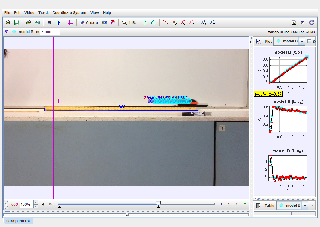
Use the live model as a shared screen demonstration before students try their own predictions and observations.
Open the simulation, adjust the controls, and compare what changes on screen before answering the concept-check questions.
Which force or interaction is responsible for the observed change in motion?
Decide which object or connected objects are being analysed.
Name the weight, normal reaction, tension, friction, drag, spring force, or contact force involved.
Use the resultant force to predict acceleration or direction of motion.
Compare the prediction with the graph, animation, or numerical display.
Use the model to practise force reasoning from a force diagram to a motion claim.
Ask: What is the system? Which forces are external? Is the resultant force zero?
Require a prediction from forces before running the model, then revise the force diagram if evidence disagrees.
These questions are generated from the topic and the concept illustrated by the simulation. Use them after students have explored the model.
Correct first attempts build a streak and unlock higher point multipliers on this device.
1. What is the central question in a dynamics investigation?
2. What does a force diagram help students do?
3. What should be used to predict acceleration?
4. If resultant force is zero, what happens to acceleration?
5. What is a strong final explanation?
Unlocks after 3 correct concept-check answers on this page.
1. A position-time graph is a straight line with positive slope. What is the best interpretation?
2. A velocity-time graph crosses from positive to negative velocity. What does the crossing mean?
3. What does the area under a velocity-time graph represent?
4. A velocity-time graph has a negative slope while velocity is still positive. What is happening?
5. What is the best way to avoid memorising graph shapes without understanding?
Anonymous activity shows this resource is being discovered, revisited, and used by learners in different places.
Country or region is inferred anonymously from server location headers when available. No names, accounts, or IP addresses are shown.