Teacher Demonstration
Use the live model as a shared screen demonstration before students try their own predictions and observations.
Analyse Atwoodmachine as a Tracker video-analysis activity for kinematics, using calibrated video points and graphs to describe motion.
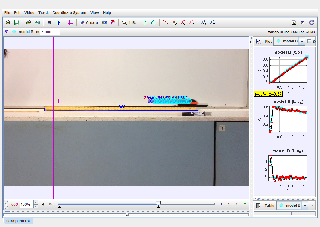
Use the live model as a shared screen demonstration before students try their own predictions and observations.
Open the simulation, adjust the controls, and compare what changes on screen before answering the concept-check questions.
How does changing the mass difference alter the direction and size of the acceleration?
Start with equal masses and observe the zero or near-zero acceleration case.
Increase one mass while keeping the other fixed, then predict the direction of motion.
Repeat with a larger mass difference and compare the displayed acceleration or motion.
Explain the result using net external force divided by total mass.
Use the model to move students from single-object F = ma to a connected-system view.
Ask: Which force drives the whole system? Why does increasing mass difference matter?
Draw force diagrams for each mass, then a simplified whole-system diagram where internal tension cancels.
These questions are generated from the topic and the concept illustrated by the simulation. Use them after students have explored the model.
Correct first attempts build a streak and unlock higher point multipliers on this device.
1. In an ideal Atwood machine, what provides the net driving force for the two-mass system?
2. If the two masses are equal, what should the acceleration be in the ideal model?
3. Why does a larger mass difference usually increase acceleration?
4. When analysing one hanging mass, which force acts upward?
5. What is the strongest explanation after using the model?
Unlocks after 3 correct concept-check answers on this page.
1. A position-time graph is a straight line with positive slope. What is the best interpretation?
2. A velocity-time graph crosses from positive to negative velocity. What does the crossing mean?
3. What does the area under a velocity-time graph represent?
4. A velocity-time graph has a negative slope while velocity is still positive. What is happening?
5. What is the best way to avoid memorising graph shapes without understanding?
Anonymous activity shows this resource is being discovered, revisited, and used by learners in different places.
Country or region is inferred anonymously from server location headers when available. No names, accounts, or IP addresses are shown.