Teacher Demonstration
Use the live model as a shared screen demonstration before students try their own predictions and observations.
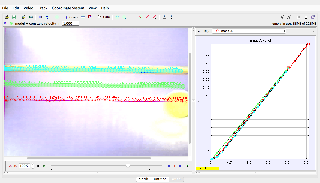
Use Airpuckconstantvelocity as a Tracker model-building activity: compare Model A constant velocity with Model B, where an initial push acts from t = 0 to 0.3 s before the air puck continues at nearly constant velocity.
Use the live model as a shared screen demonstration before students try their own predictions and observations.
Open the simulation, adjust the controls, and compare what changes on screen before answering the concept-check questions.
Which model best matches the air-puck motion, and what does its force function say about the motion after the push ends?
Open the Model Builder and select Model A constant velocity. Note that vx is set while fx and fy are zero.
Switch to Model B initial push for t = 0 to 0.3 s. Read the Push parameter and the force function fx = if(t < 0.3, Push, 0).
Overlay each model on the tracked air-puck motion and compare the model path or graph with the measured data.
Decide whether the air puck needs a continuing horizontal force to keep moving, or only an initial push followed by near-zero net force.
Use this as a model-building lesson on Newton's first law. Students compare a pure constant-velocity model with a short-push model and judge which assumptions explain the data.
Ask: What does fx = 0 mean in Model A? What happens to fx after 0.3 s in Model B? If the air puck keeps moving after the push, does that prove a continuing push is present?
Make students write the model assumption before judging the fit: Model A assumes no horizontal resultant force; Model B assumes a brief initial force and then zero horizontal force. Then require graph or overlay evidence for their choice.
The key conceptual move is separating the force that starts or changes motion from the absence of horizontal resultant force during later constant-velocity motion.
These questions are generated from the topic and the concept illustrated by the simulation. Use them after students have explored the model.
Correct first attempts build a streak and unlock higher point multipliers on this device.
1. In Model A, what does fx = 0 represent?
2. In Model B, what does fx = if(t < 0.3, Push, 0) mean?
3. Why compare Model A and Model B with the measured track?
4. What misconception can this activity challenge?
5. What makes a strong conclusion?
Unlocks after 3 correct concept-check answers on this page.
1. A student says Model B proves a force keeps acting because the puck keeps moving after 0.3 s. What is the best feedback?
2. What should students compare before deciding whether Model A or Model B is more appropriate?
3. Why is Model A still useful even if Model B includes an initial push?
Anonymous activity shows this resource is being discovered, revisited, and used by learners in different places.
Country or region is inferred anonymously from server location headers when available. No names, accounts, or IP addresses are shown.