Teacher Demonstration
Use the live model as a shared screen demonstration before students try their own predictions and observations.
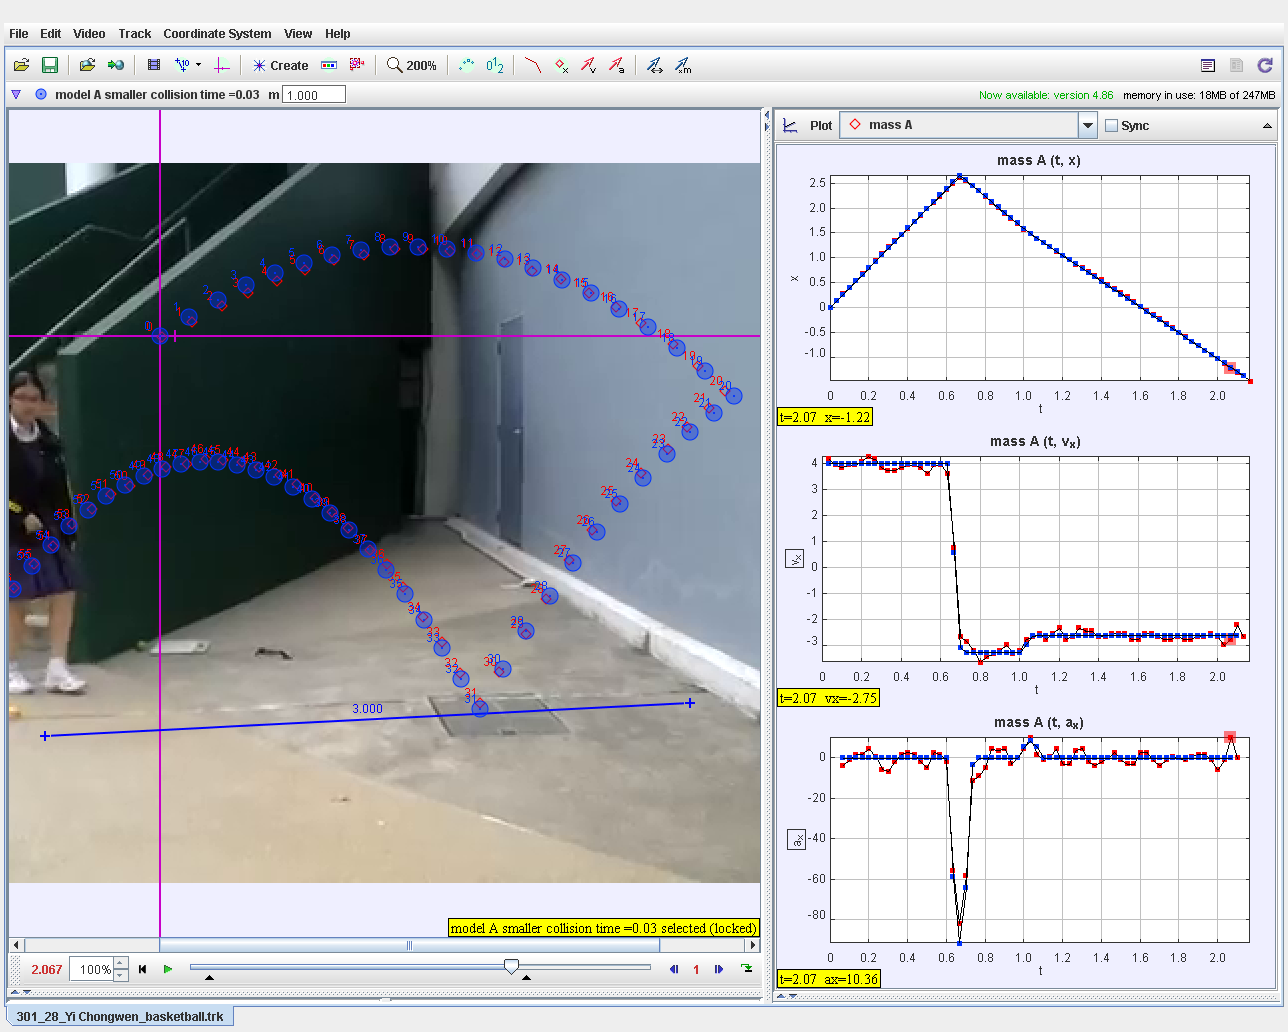
Use Tennisballmodelli Anqi as a Tracker model-building activity: compare measured video data with model tracks, parameters, initial values, and force functions to decide which assumptions fit the motion.
Use the live model as a shared screen demonstration before students try their own predictions and observations.
Open the simulation, adjust the controls, and compare what changes on screen before answering the concept-check questions.
Which model assumptions explain the measured motion, and what evidence shows that the model is a good or poor fit?
Open the Model Builder and read the model name, parameters, initial values, and force functions.
Before changing values, predict how the model should move if its assumptions are correct.
Run or overlay the model against the tracked data and compare path, velocity graph, or mismatch.
Change one parameter or force function at a time, then explain whether the evidence improved the model fit.
Use this as a scientific modelling activity rather than only a video-analysis task. Students should state the model assumption, test it against data, and revise it if necessary.
Ask: What is measured and what is modelled? Which parameter has physical meaning? Which force function or initial value controls the model behaviour? Where does the model fail?
Require a claim-evidence-reasoning response: the claim names the model, the evidence cites the overlay or graph, and the reasoning links the parameter or force function to the physics.
These questions are generated from the topic and the concept illustrated by the simulation. Use them after students have explored the model.
Correct first attempts build a streak and unlock higher point multipliers on this device.
1. What is the purpose of a Tracker model-builder track?
2. What do parameters and initial values represent?
3. Why change one model parameter at a time?
4. What evidence should be used to judge the model?
5. What makes a strong model-building conclusion?
Unlocks after 3 correct concept-check answers on this page.
1. A model matches early frames but drifts away later. What is the best next step?
2. Why is a model with a named force function more than a curve fit?
3. What should students report when two models both look reasonable?
Anonymous activity shows this resource is being discovered, revisited, and used by learners in different places.
Country or region is inferred anonymously from server location headers when available. No names, accounts, or IP addresses are shown.