I Want 2 Study
Chemistry

Volume of strong base added / cm3', title Text Style: {color: '#FF0000', bold: 1, italic: 0, font Size: 20, font Name: 'Lucida Sans Unicode' }, view Window: { min: 0, max: 50 }, ticks: [0, 5, 10, 15, 20, 25, 30, 35, 40, 45, 50]}, v Axis: { title: 'p H', title Text Style: {color: '#FF0000', bold: 1, italic: 0, font Size: 20, font Name: 'Lucida Sans Unicode' }, view Window: { min: 0, max: 14 }, ticks: [0,1,2,3,4,5,6,7,8,9,10,11,12,13,14] }, 'chart Area': { top: 20 }, 'legend': {position: 'none'}, 'tooltip': {is Html: true}, // This MUST be set to true for your chart to show. 'width':700, 'height':450, line Width: 3, colors: ['black'] }; // Instantiate and draw our chart, passing in some options. var chart = new google.visualization.Line Chart(document.get Element By Id('chart_div')); google.visualization.events.add Listener(chart, 'ready', function() { var gradient = create SVG('linear Gradient', {x1:0,y1:0, x2:0, y1:1}, {id:'fx'}); document.get Element By Id("chart_div").query Selector('svg>defs').append Child(gradient); gradient.append Child(create SVG('stop',{offset:'0%'})); gradient.append Child(create SVG('stop',{offset:'25%'})); gradient.append Child(create SVG('stop',{offset:'50%'})); gradient.append Child(create SVG('stop',{offset:'100%'})); $("svg").find("[clip-path]").parent().find("rect").first().attr("fill", "url(#fx)").attr("fill-opacity", "1"); change Chart Color($("#indtype").val()); }); function select Handler() { var selected Item = chart.get Selection()[0]; if (selected Item) { var p X = data.get Value(selected Item.row, 0).to Fixed(2); var p Y = data.get Value(selected Item.row, 1).to Fixed(2); $("#p X").val(p X); $("#p Y").val(p Y); } } google.visualization.events.add Listener(chart, 'select', select Handler); chart.draw(data, options) } function get Float(id) { return parse Float( $("#"+id).val() ); } function set Float(id, v) { $("#"+id).val( parse Float(v).to Fixed(2) ) ; } function p HSA(conc) { return -Math.log10(conc); } function p HSB(conc) { return 14 + Math.log10(conc) } function calculate PH() { if (burette Vol.to Fixed(2) == get Float("bvol").to Fixed(2) ) { return 7.0; } else if (burette Vol < get Float("bvol") ) { return p HSA( ( init Mol - burette Vol * get Float("bconc") * get Float("btype") ) / (tot Vol) ); } else if (burette Vol > get Float("bvol") ) { return p HSB( ( (burette Vol*get Float("bconc")*get Float("btype")-init Mol) ) / (tot Vol) ); } } function init Vars() { init Mol = get Float("aconc") * get Float("avol") * get Float("atype"); tot Vol = get Float("avol"); burette Vol = 0; tooltip Charts HTML = {}; generate Graph For Current Burette Volume(); } function generate Graph For Current Burette Volume() { var tot Acid Mol = get Float("aconc") * get Float("avol") * get Float("atype") / 1000; var acid Mol = tot Acid Mol - burette Vol * get Float("bconc") * get Float("btype") / 1000; var salt Mol = burette Vol * get Float("bconc") * get Float("btype") / 1000; if (salt Mol > tot Acid Mol) salt Mol = tot Acid Mol; var data = new google.visualization.Data Table(); data.add Column('string', 'Species Type'); data.add Column('number', 'Mols'); data.add Rows([ ["strong acid", acid Mol > 0 ? acid Mol : 0], ["salt", salt Mol], ["xs strong base", acid Mol < 0 ? -acid Mol : 0] ]); var hidden Div = document.get Element By Id('hidden_div'); var tooltip Chart = new google.visualization.Column Chart(hidden Div); var cur Burette Vol = burette Vol.to Fixed(2); // As the following function is a callback, it means that by the time it is called burette Vol may have changed. So we fixed it in a variable now google.visualization.events.add Listener(tooltip Chart, 'ready', function() { // Get the PNG of the chart and set it as the src of an img tag, to be displayed as HTML tooltip Charts HTML[cur Burette Vol] = '<img src="' + tooltip Chart.get Image URI() + '">';; }); var tooltip Options = { title: 'Amount of each species present', v Axis: { title: 'Amount / mol', title Text Style: {color: 'black', bold: 1, italic: 0, font Size: 10, font Name: 'Lucida Sans Unicode' }, view Window: { min: 0, max: get Float("aconc") * get Float("avol") * get Float("atype") / 1000 }, }, legend: {position: 'none'}, axes: { y: { 0: {label: "Amount / mol"} } } }; tooltip Chart.draw(data, tooltip Options); } function titrate Step() { if (page Loaded == false) { alert("Please wait for a while, page scripts still loading."); return; } if (init Mol == -1) init Vars(); burette Vol += get Float("inc"); tot Vol += get Float("inc"); generate Graph For Current Burette Volume( ); $("#titable tbody").html( $("#titable tbody").html() + "<tr><td>" + burette Vol.to Fixed(2) + "</td><td>" + calculate PH().to Fixed(2) + "</td><td>" + tot Vol.to Fixed(2) + "</td></tr>"); $("#titable").parent().scroll Top( $("#titable").height() ) } function update Neutralisation() { $("#bvol").val( ( ( get Float("avol") * get Float("atype") * get Float("aconc") ) / ( get Float("btype") * get Float("bconc") ) ).to Fixed(2) ); if (get Float("bvol") > 50) {alert("Titre volume cannot exceed maximum capacity of burette!");} else if (get Float("bvol") < 15) {alert("Titre volume too small, leads to large percentage error!");} reset Titrate(); } function auto Titrate() { if (page Loaded == false) { alert("Please wait for a while, page scripts still loading."); return; } if ( burette Vol < get Float("stopt")) { titrate Step(); window.set Timeout("auto Titrate()", 1); // Set a break before next function call, so that display worker gets a chance to update the display } else { draw Chart(); } } function reset Titrate() { $("#titable tbody").html( "" ) draw Chart(); init Vars(); $("#titable tbody").html( $("#titable tbody").html() + "<tr><td>" + burette Vol.to Fixed(2) + "</td><td>" + calculate PH().to Fixed(2) + "</td><td>" + tot Vol.to Fixed(2) + "</td></tr>"); } var chart Col = {'0': ["white", "white", "white", "white"], '1': ["red", "orange", "#ffff33", "#ffff33"], '2': ["#990099", "grey", "#009933", "#009933"], '3': ["white", "white", "white","fuchsia"], '4': ["white", "white", "white","#2c5ba5"], }; function change Chart Color(ind Type) { $("#fx stop:nth-child(1)").css("stop-color",chart Col[ind Type][0]) $("#fx stop:nth-child(2)").css("stop-color",chart Col[ind Type][1]) $("#fx stop:nth-child(3)").css("stop-color",chart Col[ind Type][2]) $("#fx stop:nth-child(4)").css("stop-color",chart Col[ind Type][3]) } function check Boxes() { if (get Float("p X") < get Float("bvol") && get Float("p X") > 0 && $("#SA").prop('checked')==true && $("#NS").prop('checked')==true && $("#SB").prop('checked')==false) {alert("Good job!");} else if (get Float("p X") > get Float("bvol") && $("#SA").prop('checked')==false && $("#NS").prop('checked')==true && $("#SB").prop('checked')==true) {alert("Good job!");} else if (get Float("p X") == get Float("bvol") && $("#SA").prop('checked')==false && $("#NS").prop('checked')==true && $("#SB").prop('checked')==false) {alert("Good job!");} else if (get Float("p X") == 0 && $("#SA").prop('checked')==true && $("#NS").prop('checked')==false && $("#SB").prop('checked')==false) {alert("Good job!");} else {alert("Please try again.");} } </script> <body> <ul> <li><a class="active" a href="index.html">Introduction</a></li> <li><a href="SASB.html">Strong Acid - Strong Base</a></li> <li><a href="SBSA.html">Strong Base - Strong Acid</a></li> <li><a href="WASB.html">Weak Acid - Strong Base</a></li> <li><a href="WBSA.html">Weak Base - Strong Acid</a></li> <li><a href="SBWA.html">Strong Base - Weak Acid</a></li> <li><a href="SAWB.html">Strong Acid - Weak Base</a></li> </ul> <div class="hover_img"> <p style="font-size:20px"><b>Titration Curve of Strong Acid against Strong Base</b> <a href="#">(image)<span><img src="SASB.png" height=500 border=2 ></span></a> </div> </p> <table id='main Table' border=0 cellspacing=5 cellpadding=5> <tr><td><table cellpadding=5 width="20%"> <tr><td colspan=3 class='titlebg'>Set Titration Parameters</td></tr> <tr><td width="10%">[acid] = </td><td><input type='input' onchange='update Neutralisation()' class='inputbg box' size="10" id='aconc' value="1.00" /><br /><div id="acid Slider"></td><td>mol dm-3</td></tr> <tr><td>Strong acid is</td><td colspan=2><select id='atype' class='inputbg box' onchange='update Neutralisation()'> <option value=1>monoprotic</option> <option value=2>diprotic</option></select></td></tr> <tr><td>[base] = </td><td><input type='input' onchange='update Neutralisation()' class='inputbg box'size="10" id='bconc' value="1.00"/><br /><div id="base Slider"></td><td>mol dm-3</td></tr> <tr><td>Strong base is</td><td colspan=2><select id='btype' class='inputbg box' onchange='update Neutralisation()'> <option value=1>monoprotic</option> <option value=2>diprotic</option></select></td></tr> <tr><td>Vol of strong acid in conical flask</td><td><select id='avol' class='inputbg box' onchange="update Neutralisation();"> <option value=25>25.0</option> <option value=10>10.0</option></select></td><td>cm3</td></tr> <tr><td>Vol of strong base req for complete neutralisation</td><td><input type='input'class='box' size="10" id='bvol' value="25.00" disabled /></td><td>cm3</td></tr> <tr><td>Choice of indicator</td><td colspan=2><select id='indtype' class='inputbg box' onchange='change Chart Color(this.value)'> <option value='0'>no indicator</option> <option value='1'>methyl orange</option> <option value='2'>screened methyl orange</option> <option value='3'>phenolphthalein</option> <option value='4'>thymolphthalein</option></select <html> <style type='text/css'> p {font-family: "Lucida Sans Unicode", "Lucida Grande", sans-serif; margin-top: 20px; margin-left:20px;} #main Table { width: 100%; font-family: "Lucida Sans Unicode", "Lucida Grande", sans-serif} #main Table td { vertical-align:top; font-size: 10pt; } .button { font-family: "Lucida Sans Unicode", "Lucida Grande", sans-serif; font-size: 120%; padding: 10px; width: 100% } .box { font-family: "Lucida Sans Unicode", "Lucida Grande", sans-serif; font-size: 100%; padding: 2px; } #titable th { padding: 5px; margin: 5px;} #titable td { text-align : center } .greenbg { background-color:66FF66 } .redbg { background-color:pink } .inputbg { background-color:FFFF00 } .titlebg { background-color:ccddff; font-weight: bold; line-height: 200%; text-align : center; padding: 5px; margin: 5px; width: 500px} #fx stop:nth-child(1){ stop-color: white; } #fx stop:nth-child(2){ stop-color: white; } #fx stop:nth-child(3){ stop-color: white; } ul {list-style-type: none;margin: 0;padding: 0;overflow: hidden;background-color: ccddff;} li {font-family: "Lucida Sans Unicode", "Lucida Grande", sans-serif; font-size: 80%; float: left;} li a, .dropbtn { display: inline-block; color: black; font-weight: bold; text-align: center; padding: 14px 16px; text-decoration: none; } li a:hover, .dropdown:hover .dropbtn {background-color: 99b3ff;} .hover_img a { position:relative;} .hover_img a span { position:absolute; display:none; z-index:99; background-color: ffffff; left:50%; -webkit-transform: translate X(-50%); -ms-transform: translate X(-50%); transform: translate X(-50%);} .hover_img a:hover span { display:block; } </style> <link rel="stylesheet" href="https://code.jquery.com/ui/1.11.4/themes/smoothness/jquery-ui.css"> <script src="https://ajax.googleapis.com/ajax/libs/jquery/2.2.2/jquery.min.js"></script> <script src="https://code.jquery.com/ui/1.11.4/jquery-ui.js"></script> <script src="https://rawgit.com/jmosbech/Sticky Table Headers/master/js/jquery.stickytableheaders.min.js"></script> <script type="text/javascript" src="https://www.gstatic.com/charts/loader.js"></script> <script type="text/javascript"> google.charts.load('current', {'packages':['corechart']}); // Load the Visualization API and the corechart package. google.charts.set On Load Callback(first Load); // Set a callback to run when the Google Visualization API is loaded. var burette Vol = 0; var init Mol = -1; var tot Vol = 0; function create SVG(n,a,b){ var xmlns = "http://www.w3.org/2000/svg"; var e = document.create Element NS (xmlns, n); for(var k in a){ e.set Attribute NS (null, k,a[k]); } for(var k in b){ e.set Attribute (k,b[k]); } return e; }; function first Load() { $(document).ready( function() { $("#titable tbody").html( $("#titable tbody").html() + "<tr><td>" + burette Vol.to Fixed(2) + "</td><td>" + calculate PH().to Fixed(2) + "</td><td>" + tot Vol.to Fixed(2) + "</td></tr>"); update Neutralisation(); $('#titable').sticky Table Headers({ scrollable Area: $('#titable').parent() , fixed Offset:-30 }); $( "#acid Slider" ).slider({ value:100, min: 5, max: 200, step: 5, slide: function( event, ui ) { set Float("aconc", ui.value / 100); }, stop: function( event, ui ) { update Neutralisation(); } }); $( "#base Slider" ).slider({ value:100, min: 5, max: 200, step: 5, slide: function( event, ui ) { set Float("bconc", ui.value / 100); }, stop: function( event, ui ) { update Neutralisation(); } }); $( "#stop TSlider" ).slider({ value:500, min: 10, max: 500, step: 10, slide: function( event, ui ) { set Float("stopt", ui.value / 10); } }); page Loaded = true; }); } function draw Chart() { // Create the data table. var data = new google.visualization.Data Table(); data.add Column('number', 'Volume'); data.add Column('number', 'p H'); var rows = $("#titable tbody tr"); for (i = 0; i < rows.length; i++) data.add Row([ parse Float($( rows[i] ).children()[0].inner HTML), parse Float( $( rows[i] ).children()[1].inner HTML ) ]); // Set chart options var options = { h Axis: { title: 'Volume of weak base added / cm3', title Text Style: {color: '#FF0000', bold: 1, italic: 0, font Size: 20, font Name: 'Lucida Sans Unicode' }, view Window: { min: 0, max: 50 }, ticks: [0, 5, 10, 15, 20, 25, 30, 35, 40, 45, 50]}, v Axis: { title: 'p H', title Text Style: {color: '#FF0000', bold: 1, italic: 0, font Size: 20, font Name: 'Lucida Sans Unicode' }, view Window: { min: 0, max: 14 }, ticks: [0,1,2,3,4,5,6,7,8,9,10,11,12,13,14] }, 'chart Area': { top: 20 }, 'legend': {position: 'none'}, 'width':700, 'height':450, line Width: 3, colors: ['black'] }; // Instantiate and draw our chart, passing in some options. var chart = new google.visualization.Line Chart(document.get Element By Id('chart_div')); google.visualization.events.add Listener(chart, 'ready', function() { var gradient = create SVG('linear Gradient', {x1:0,y1:0, x2:0, y1:1}, {id:'fx'}); document.get Element By Id("chart_div").query Selector('svg>defs').append Child(gradient); gradient.append Child(create SVG('stop',{offset:'0%'})); gradient.append Child(create SVG('stop',{offset:'25%'})); gradient.append Child(create SVG('stop',{offset:'50%'})); gradient.append Child(create SVG('stop',{offset:'100%'})); $("svg").find("[clip-path]").parent().find("rect").first().attr("fill", "url(#fx)").attr("fill-opacity", "1"); change Chart Color($("#indtype").val()); }); function select Handler() { var selected Item = chart.get Selection()[0]; if (selected Item) { var p X = data.get Value(selected Item.row, 0).to Fixed(2); var p Y = data.get Value(selected Item.row, 1).to Fixed(2); $("#p X").val(p X); $("#p Y").val(p Y); } } google.visualization.events.add Listener(chart, 'select', select Handler); chart.draw(data, options) } function get Float(id) { return parse Float( $("#"+id).val() ); } function set Float(id, v) { $("#"+id).val( parse Float(v).to Fixed(2) ) ; } function calculatep Kb() { var x = (-Math.log10(get Float("Kb"))).to Fixed(2); $("#p Kb").val(x); if(get Float("p Kb")<2 || get Float("p Kb")>10) {alert("check Kb value, use scientific notation");} } function p HWB() { return 14 + Math.log10(Math.sqrt( get Float("Kb") * get Float("bconc") )); } function p HBB(conc B, conc S) { return 14 - (-Math.log10(get Float("Kb")) + (Math.log10(conc S/conc B))); } function p HWA(conc) { return -Math.log10(Math.sqrt(1e-14/get Float("Kb")*conc)); } function p HSA(conc) { return -Math.log10(conc) } function calculate PH() { if ( burette Vol.to Fixed(2) == 0 ) { return p HSA(get Float("aconc") * get Float("atype")); } else if (burette Vol.to Fixed(2) == get Float("bvol").to Fixed(2) ) { return p HWA(init Mol/tot Vol); } else if (burette Vol < get Float("bvol") ) { return p HSA( (init Mol - burette Vol * get Float("bconc")) / (tot Vol) ); } else if (burette Vol > get Float("bvol") ) { return p HBB( ( burette Vol * get Float("bconc") - init Mol ), (init Mol) ); } } function init Vars() { init Mol = get Float("aconc") * get Float("avol") * get Float("atype"); tot Vol = get Float("avol"); burette Vol = 0; } function titrate Step() { if (init Mol == -1) init Vars(); burette Vol += get Float("inc"); tot Vol += get Float("inc"); $("#titable tbody").html( $("#titable tbody").html() + "<tr><td>" + burette Vol.to Fixed(2) + "</td><td>" + calculate PH().to Fixed(2) + "</td><td>" + tot Vol.to Fixed(2) + "</td></tr>"); $("#titable").parent().scroll Top( $("#titable").height() ) } function update Neutralisation() { $("#bvol").val( ( ( get Float("avol") * get Float("aconc") * get Float("atype") ) / ( get Float("bconc") ) ).to Fixed(2) ); if (get Float("bvol") > 50) {alert("Titre volume cannot exceed maximum capacity of burette!");} else if (get Float("bvol") < 15) {alert("Titre volume too small, leads to large percentage error!");} reset Titrate(); } function auto Titrate() { while ( burette Vol < get Float("stopt")) { titrate Step(); } } function reset Titrate() { $("#titable tbody").html( "" ) draw Chart(); init Vars(); $("#titable tbody").html( $("#titable tbody").html() + "<tr><td>" + burette Vol.to Fixed(2) + "</td><td>" + calculate PH().to Fixed(2) + "</td><td>" + tot Vol.to Fixed(2) + "</td></tr>"); } var chart Col = {'0': ["white", "white", "white", "white"], '1': ["red", "orange", "#ffff33", "#ffff33"], '2': ["#990099", "grey", "#009933", "#009933"], '3': ["white", "white", "white","fuchsia"], '4': ["white", "white", "white","#2c5ba5"], }; function change Chart Color(ind Type) { $("#fx stop:nth-child(1)").css("stop-color",chart Col[ind Type][0]) $("#fx stop:nth-child(2)").css("stop-color",chart Col[ind Type][1]) $("#fx stop:nth-child(3)").css("stop-color",chart Col[ind Type][2]) $("#fx stop:nth-child(4)").css("stop-color",chart Col[ind Type][3]) } function check Boxes() { if (get Float("p X") == 0 && $("#WB").prop('checked')==false && $("#AS").prop('checked')==false && $("#SA").prop('checked')==true) {alert("Good job!");} else if (get Float("p X") < get Float("bvol") && get Float("p X") > 0 && $("#WB").prop('checked')==false && $("#AS").prop('checked')==true && $("#SA").prop('checked')==true) {alert("Good job!");} else if (get Float("p X") > get Float("bvol") && $("#WB").prop('checked')==true && $("#AS").prop('checked')==true && $("#SA").prop('checked')==false) {alert("Good job!");} else if (get Float("p X") == get Float("bvol") && $("#WB").prop('checked')==false && $("#AS").prop('checked')==true && $("#SA").prop('checked')==false) {alert("Good job!");} else {alert("Please try again.");} } function check Buffer() { if ( (14-get Float("p Y")) > (get Float("p Kb")-1) && (14-get Float("p Y")) < (get Float("p Kb")+1) ) { if($("#buffer").prop('checked')==true) {alert("Good job!");} else {alert("Please try again. What are the 2 components required in large excess to form a buffer?");} } else if ( (14-get Float("p Y")) < (get Float("p Kb")-1) || (14-get Float("p Y")) > (get Float("p Kb")+1) ) { if($("#buffer").prop('checked')==false) {alert("Good job!");} else {alert("Please try again. What are the 2 components required in large excess to form a buffer?");} } } </script> <body> <ul> <li><a class="active" a href="index.html">Introduction</a></li> <li><a href="SASB.html">Strong Acid - Strong Base</a></li> <li><a href="SBSA.html">Strong Base - Strong Acid</a></li> <li><a href="WASB.html">Weak Acid - Strong Base</a></li> <li><a href="WBSA.html">Weak Base - Strong Acid</a></li> <li><a href="SBWA.html">Strong Base - Weak Acid</a></li> <li><a href="SAWB.html">Strong Acid - Weak Base</a></li> </ul> <div class="hover_img"> <p style="font-size:20px"><b>Titration Curve of Strong Acid against Weak Base</b> <a href="#">(image)<span><img src="SAWB.png" height=500 border=2 ></span></a></p> </div> <table id='main Table' border=0 cellspacing=5 cellpadding=5> <tr><td><table cellpadding=5 width="20%"> <tr><td colspan=3 class='titlebg'>Set Titration Parameters</td></tr> <tr><td>[acid] = </td><td><input type='input' onchange='update Neutralisation()' class='inputbg box'size="10" id='aconc' value="1.00"/><br /><div id="acid Slider"></td><td>mol dm-3</td></tr> <tr><td>Strong acid is</td><td colspan=2><select id='atype' class='inputbg box' onchange='update Neutralisation()'> <option value=1>monoprotic</option> <option value=2>diprotic</option></select></td></tr> <tr><td width="10%">[base] = </td><td><input type='input' onchange='update Neutralisation()' class='inputbg box' size="10" id='bconc' value="1.00" /><br /><div id="base Slider"></td><td>mol dm-3</td></tr> <tr><td>Kb (scientific notation) = </td><td><input type='input'class='inputbg box' size="10" id='Kb' value="1.80e-5" onchange='calculatep Kb(); update Neutralisation()' /></td><td>mol dm-3</td></tr> <tr><td>p Kb = </td><td><input type='input' class='box'size="10" id='p Kb' value="4.74" disabled /></td></tr> <tr><td>Vol of strong acid in conical flask</td><td><select id='avol' class='inputbg box' onchange="update Neutralisation();"> <option value=25>25.0</option> <option value=10>10.0</option></select></td><td>cm3</td></tr> <tr><td>Vol of weak base req for complete neutralisation</td><td><input type='input'class='box' size="10" id='bvol' value="25.00" disabled /></td><td>cm3</td></tr> <tr><td>Choice of indicator</td><td colspan=2><select id='indtype' class='inputbg box' onchange='change Chart Color(this.value)'> <option value='0'>no indicator</option> <option value='1'>methyl orange</option> <option value='2'>screened methyl orange</option> <option value='3'>phenolphthalein</option> <option value='4'>thymolphthalein</option></select></td></tr> <tr><td>Data points in increments of</td><td><select id='inc' class='inputbg box' value="1.00"> <option value=1.00>1.00</option> <option value=0.50>0.50</option> <option value=0.05>0.05 (1 drop)</option></select></td><td>cm3</td></tr> <tr><td colspan=3></td></tr> <tr><td>Stop titration at (for auto titration only)</td><td><input type='input' onchange='update Neutralisation()' class='inputbg box' size="10" id='stopt' value="50.00" /><br /><div id="stop TSlider"></td><td>cm3</td></tr> <tr><td colspan=3></td></tr> <tr> <td><input type='button' class='button greenbg' value="Do Titration Stepwise" onclick='titrate Step(); draw Chart()'></input></td> <td><input type='button' class='button redbg' value="Auto Titration" onclick='auto Titrate(); draw Chart()'></input></td> <td><input type='button' class='button' value="Reset" onclick='reset Titrate();'></input></td> </tr> </table></td> <td align=center><div id="chart_div"></div> <p class='titlebg'>Selected Point</p> Burette Volume <input type='input' class='box' size="6" id='p X' value="0.00" disabled /> p H <input type='input' class='box' size="6" id='p Y' value="0.00" disabled /><br> Select the major species present in the conical flask<br> <input type="checkbox" id="SA" value="0"> SA <input type="checkbox" id="AS" value="0"> conj acid of WB <input type="checkbox" id="WB" value="0"> xs WB <input type="submit" value="Check" onclick='check Boxes()'><br> Is solution a buffer? <input type="checkbox" id="buffer" value="0"> yes <input type="submit" value="Check" onclick='check Buffer()'> </b> </td> <td> <div style='overflow:scroll; width: 200px; height:550px'> <table id="titable"> <thead><th>Burette Vol</th><th>p H</th><th>Total Vol</th></thead> <html> <style type='text/css'> p {font-family: "Lucida Sans Unicode", "Lucida Grande", sans-serif; margin-top: 20px; margin-left:20px;} #main Table { width: 100%; font-family: "Lucida Sans Unicode", "Lucida Grande", sans-serif} #main Table td { vertical-align:top; font-size: 10pt; } .button { font-family: "Lucida Sans Unicode", "Lucida Grande", sans-serif; font-size: 120%; padding: 10px; width: 100% } .box { font-family: "Lucida Sans Unicode", "Lucida Grande", sans-serif; font-size: 100%; padding: 2px; } #titable th { padding: 5px; margin: 5px;} #titable td { text-align : center } .greenbg { background-color:66FF66 } .redbg { background-color:pink } .inputbg { background-color:FFFF00 } .titlebg { background-color:ccddff; font-weight: bold; line-height: 200%; text-align : center; padding: 5px; margin: 5px; width: 500px} #fx stop:nth-child(1){ stop-color: white; } #fx stop:nth-child(2){ stop-color: white; } #fx stop:nth-child(3){ stop-color: white; } ul {list-style-type: none;margin: 0;padding: 0;overflow: hidden;background-color: ccddff;} li {font-family: "Lucida Sans Unicode", "Lucida Grande", sans-serif; font-size: 80%; float: left;} li a, .dropbtn { display: inline-block; color: black; font-weight: bold; text-align: center; padding: 14px 16px; text-decoration: none; } li a:hover, .dropdown:hover .dropbtn {background-color: 99b3ff;} .hover_img a { position:relative;} .hover_img a span { position:absolute; display:none; z-index:99; background-color: ffffff; left:50%; -webkit-transform: translate X(-50%); -ms-transform: translate X(-50%); transform: translate X(-50%);} .hover_img a:hover span { display:block; } </style> <link rel="stylesheet" href="https://code.jquery.com/ui/1.11.4/themes/smoothness/jquery-ui.css"> <script src="https://ajax.googleapis.com/ajax/libs/jquery/2.2.2/jquery.min.js"></script> <script src="https://code.jquery.com/ui/1.11.4/jquery-ui.js"></script> <script src="https://rawgit.com/jmosbech/Sticky Table Headers/master/js/jquery.stickytableheaders.min.js"></script> <script type="text/javascript" src="https://www.gstatic.com/charts/loader.js"></script> <script type="text/javascript"> google.charts.load('current', {'packages':['corechart']}); // Load the Visualization API and the corechart package. google.charts.set On Load Callback(first Load); // Set a callback to run when the Google Visualization API is loaded. var burette Vol = 0; var init Mol = -1; var tot Vol = 0; function create SVG(n,a,b){ var xmlns = "http://www.w3.org/2000/svg"; var e = document.create Element NS (xmlns, n); for(var k in a){ e.set Attribute NS (null, k,a[k]); } for(var k in b){ e.set Attribute (k,b[k]); } return e; }; function first Load() { $(document).ready( function() { $("#titable tbody").html( $("#titable tbody").html() + "<tr><td>" + burette Vol.to Fixed(2) + "</td><td>" + calculate PH().to Fixed(2) + "</td><td>" + tot Vol.to Fixed(2) + "</td></tr>"); update Neutralisation(); $('#titable').sticky Table Headers({ scrollable Area: $('#titable').parent() , fixed Offset:-30 }); $( "#acid Slider" ).slider({ value:100, min: 5, max: 200, step: 5, slide: function( event, ui ) { set Float("aconc", ui.value / 100); }, stop: function( event, ui ) { update Neutralisation(); } }); $( "#base Slider" ).slider({ value:100, min: 5, max: 200, step: 5, slide: function( event, ui ) { set Float("bconc", ui.value / 100); }, stop: function( event, ui ) { update Neutralisation(); } }); $( "#stop TSlider" ).slider({ value:500, min: 10, max: 500, step: 10, slide: function( event, ui ) { set Float("stopt", ui.value / 10); } }); page Loaded = true; }); } function draw Chart() { // Create the data table. var data = new google.visualization.Data Table(); data.add Column('number', 'Volume'); data.add Column('number', 'p H'); var rows = $("#titable tbody tr"); for (i = 0; i < rows.length; i++) data.add Row([ parse Float($( rows[i] ).children()[0].inner HTML), parse Float( $( rows[i] ).children()[1].inner HTML ) ]); // Set chart options var options = { h Axis: { title: 'Volume of strong acid added / cm3', title Text Style: {color: '#FF0000', bold: 1, italic: 0, font Size: 20, font Name: 'Lucida Sans Unicode' }, view Window: { min: 0, max: 50 }, ticks: [0, 5, 10, 15, 20, 25, 30, 35, 40, 45, 50]}, v Axis: { title: 'p H', title Text Style: {color: '#FF0000', bold: 1, italic: 0, font Size: 20, font Name: 'Lucida Sans Unicode' }, view Window: { min: 0, max: 14 }, ticks: [0,1,2,3,4,5,6,7,8,9,10,11,12,13,14] }, 'chart Area': { top: 20 }, 'legend': {position: 'none'}, 'width':700, 'height':450, line Width: 3, colors: ['black'] }; // Instantiate and draw our chart, passing in some options. var chart = new google.visualization.Line Chart(document.get Element By Id('chart_div')); google.visualization.events.add Listener(chart, 'ready', function() { var gradient = create SVG('linear Gradient', {x1:0,y1:0, x2:0, y1:1}, {id:'fx'}); document.get Element By Id("chart_div").query Selector('svg>defs').append Child(gradient); gradient.append Child(create SVG('stop',{offset:'0%'})); gradient.append Child(create SVG('stop',{offset:'25%'})); gradient.append Child(create SVG('stop',{offset:'50%'})); gradient.append Child(create SVG('stop',{offset:'100%'})); $("svg").find("[clip-path]").parent().find("rect").first().attr("fill", "url(#fx)").attr("fill-opacity", "1"); change Chart Color($("#indtype").val()); }); function select Handler() { var selected Item = chart.get Selection()[0]; if (selected Item) { set Float( "p X", data.get Value(selected Item.row, 0) ); set Float( "p Y", data.get Value(selected Item.row, 1) ); } } google.visualization.events.add Listener(chart, 'select', select Handler); chart.draw(data, options) } function get Float(id) { return parse Float( $("#"+id).val() ); } function set Float(id, v) { $("#"+id).val( parse Float(v).to Fixed(2) ) ; } function p HSA(conc) { return -Math.log10(conc); } function p HSB(conc) { return 14 + Math.log10(conc) } function calculate PH() { if (burette Vol.to Fixed(2) == get Float("avol").to Fixed(2) ){ return 7.0; } else if (burette Vol < get Float("avol") ) { return p HSB( ( init Mol - burette Vol * get Float("aconc") * get Float("atype") ) / (tot Vol) ); } else if (burette Vol > get Float("avol") ) { return p HSA(( ( burette Vol * get Float("aconc") * get Float("atype") ) - init Mol ) / (tot Vol) ); } } function init Vars() { init Mol = get Float("bconc") * get Float("bvol") * get Float("btype"); tot Vol = get Float("bvol"); burette Vol = 0; } function titrate Step() { if (init Mol == -1) init Vars(); burette Vol += get Float("inc"); tot Vol += get Float("inc"); $("#titable tbody").html( $("#titable tbody").html() + "<tr><td>" + burette Vol.to Fixed(2) + "</td><td>" + calculate PH().to Fixed(2) + "</td><td>" + tot Vol.to Fixed(2) + "</td></tr>"); $("#titable").parent().scroll Top( $("#titable").height() ) } function update Neutralisation() { set Float("avol", get Float("bvol") * get Float("btype") * get Float("bconc") / (get Float("atype") * get Float("aconc")) ); if (get Float("avol") > 50) {alert("Titre volume cannot exceed maximum capacity of burette!");} else if (get Float("avol") < 15) {alert("Titre volume too small, leads to large percentage error!");} reset Titrate(); } function auto Titrate() { while ( burette Vol < get Float("stopt")) { titrate Step(); } } function reset Titrate() { $("#titable tbody").html( "" ) draw Chart(); init Vars(); $("#titable tbody").html( $("#titable tbody").html() + "<tr><td>" + burette Vol.to Fixed(2) + "</td><td>" + calculate PH().to Fixed(2) + "</td><td>" + tot Vol.to Fixed(2) + "</td></tr>"); } var chart Col = {'0': ["white", "white", "white", "white"], '1': ["red", "orange", "#ffff33", "#ffff33"], '2': ["#990099", "grey", "#009933", "#009933"], '3': ["white", "white", "white","fuchsia"], '4': ["white", "white", "white","#2c5ba5"], }; function change Chart Color(ind Type) { $("#fx stop:nth-child(1)").css("stop-color",chart Col[ind Type][0]) $("#fx stop:nth-child(2)").css("stop-color",chart Col[ind Type][1]) $("#fx stop:nth-child(3)").css("stop-color",chart Col[ind Type][2]) $("#fx stop:nth-child(4)").css("stop-color",chart Col[ind Type][3]) } function check Boxes() { if (get Float("p X") < get Float("avol") && get Float("p X") > 0 && $("#SB").prop('checked')==true && $("#NS").prop('checked')==true && $("#SA").prop('checked')==false) {alert("Good job!");} else if (get Float("p X") > get Float("avol") && $("#SB").prop('checked')==false && $("#NS").prop('checked')==true && $("#SA").prop('checked')==true) {alert("Good job!");} else if (get Float("p X") == get Float("avol") && $("#SB").prop('checked')==false && $("#NS").prop('checked')==true && $("#SA").prop('checked')==false) {alert("Good job!");} else if (get Float("p X") == 0 && $("#SB").prop('checked')==true && $("#NS").prop('checked')==false && $("#SA").prop('checked')==false) {alert("Good job!");} else {alert("Please try again.");} } </script> <body> <ul> <li><a class="active" a href="index.html">Introduction</a></li> <li><a href="SASB.html">Strong Acid - Strong Base</a></li> <li><a href="SBSA.html">Strong Base - Strong Acid</a></li> <li><a href="WASB.html">Weak Acid - Strong Base</a></li> <li><a href="WBSA.html">Weak Base - Strong Acid</a></li> <li><a href="SBWA.html">Strong Base - Weak Acid</a></li> <li><a href="SAWB.html">Strong Acid - Weak Base</a></li> </ul> <div class="hover_img"> <p style="font-size:20px"><b>Titration Curve of Strong Base against Strong Acid</b> <a href="#">(image)<span><img src="SBSA.png" height=500 border=2 ></span></a></p> </div> <table id='main Table' border=0 cellspacing=5 cellpadding=5> <tr><td><table cellpadding=5 width="20%"> <tr><td colspan=3 class='titlebg'>Set Titration Parameters</td></tr> <tr><td>[base] = </td><td><input type='input' onchange='update Neutralisation()' class='inputbg box'size="10" id='bconc' value="1.00"/><br /><div id="base Slider"></td><td>mol dm-3</td></tr> <tr><td>Strong base is</td><td colspan=2><select id='btype' class='inputbg box' onchange='update Neutralisation()'> <option value=1>monoprotic</option> <option value=2>diprotic</option></select></td></tr> <tr><td width="10%">[acid] = </td><td><input type='input' onchange='update Neutralisation()' class='inputbg box' size="10" id='aconc' value="1.00" /><br /><div id="acid Slider"></td><td>mol dm-3</td></tr> <tr><td>Strong acid is</td><td colspan=2><select id='atype' class='inputbg box' onchange='update Neutralisation()'> <option value=1>monoprotic</option> <option value=2>diprotic</option></select></td></tr> <tr><td>Vol of strong base in conical flask</td><td><select id='bvol' class='inputbg box' onchange="update Neutralisation();"> <option value=25>25.0</option> <option value=10>10.0</option></select></td><td>cm3</td></tr> <tr><td>Vol of strong acid req for complete neutralisation</td><td><input type='input'class='box' size="10" id='avol' value="25.00" disabled /></td><td>cm3</td></tr> <tr><td>Choice of indicator</td><td colspan=2><select id='indtype' class='inputbg box' onchange='change Chart Color(this.value)'> <option value='0'>no indicator</option> <option value='1'>methyl orange</option> <option value='2'>screened methyl orange</option> <option value='3'>phenolphthalein</option> <option value='4'>thymolphthalein</option></select></td></tr> <tr><td>Data points in increments of</td><td><select id='inc' class='inputbg box' value="1.00"> <option value=1.00>1.00</option> <option value=0.50>0.50</option> <option value=0.05>0.05 (1 drop)</option></select></td><td>cm3</td></tr> <tr><td colspan=3></td></tr> <tr><td>Stop titration at (for auto titration only)</td><td><input type='input' onchange='update Neutralisation()' class='inputbg box' size="10" id='stopt' value="50.00" /><br /><div id="stop TSlider"></td><td>cm3</td></tr> <tr><td colspan=3></td></tr> <tr> <td><input type='button' class='button greenbg' value="Do Titration Stepwise" onclick='titrate Step(); draw Chart()'></input></td> <td><input type='button' class='button redbg' value="Auto Titration" onclick='auto Titrate(); draw Chart()'></input></td> <td><input type='button' class='button' value="Reset" onclick='reset Titrate();'></input></td> </tr> </table></td> <td align=center><div id="chart_div"></div> <p class='titlebg'>Selected Point</p> Burette Volume <input type='input' class='box' size="6" id='p X' value="0.00" disabled /> p H <input type='input' class='box' size="6" id='p Y' value="0.00" disabled /><br> Select all the species present in the conical flask<br> <input type="checkbox" id="SB" value="0"> strong base <input type="checkbox" id="NS" value="0"> neutral salt <input type="checkbox" id="SA" value="0"> strong acid <input type="submit" value="Check" onclick='check Boxes()'> </b> </td> <td> <div style='overflow:scroll; width: 200px; height:550px'> <table id="titable"> <thead><th>Burette Vol</th><th>p H</th><th>Total Vol</th></thead> <tbody></tbody> </table> </div> </td> </tr> </table> </body> </html> <html> <style type='text/css'> p {font-family: "Lucida Sans Unicode", "Lucida Grande", sans-serif; margin-top: 20px; margin-left:20px;} #main Table { width: 100%; font-family: "Lucida Sans Unicode", "Lucida Grande", sans-serif} #main Table td { vertical-align:top; font-size: 10pt; } .button { font-family: "Lucida Sans Unicode", "Lucida Grande", sans-serif; font-size: 120%; padding: 10px; width: 100% } .box { font-family: "Lucida Sans Unicode", "Lucida Grande", sans-serif; font-size: 100%; padding: 2px; } #titable th { padding: 5px; margin: 5px;} #titable td { text-align : center } .greenbg { background-color:66FF66 } .redbg { background-color:pink } .inputbg { background-color:FFFF00 } .titlebg { background-color:ccddff; font-weight: bold; line-height: 200%; text-align : center; padding: 5px; margin: 5px; width: 500px} #fx stop:nth-child(1){ stop-color: white; } #fx stop:nth-child(2){ stop-color: white; } #fx stop:nth-child(3){ stop-color: white; } ul {list-style-type: none;margin: 0;padding: 0;overflow: hidden;background-color: ccddff;} li {font-family: "Lucida Sans Unicode", "Lucida Grande", sans-serif; font-size: 80%; float: left;} li a, .dropbtn { display: inline-block; color: black; font-weight: bold; text-align: center; padding: 14px 16px; text-decoration: none; } li a:hover, .dropdown:hover .dropbtn {background-color: 99b3ff;} .hover_img a { position:relative;} .hover_img a span { position:absolute; display:none; z-index:99; background-color: ffffff; left:50%; -webkit-transform: translate X(-50%); -ms-transform: translate X(-50%); transform: translate X(-50%);} .hover_img a:hover span { display:block; } </style> <link rel="stylesheet" href="https://code.jquery.com/ui/1.11.4/themes/smoothness/jquery-ui.css"> <script src="https://ajax.googleapis.com/ajax/libs/jquery/2.2.2/jquery.min.js"></script> <script src="https://code.jquery.com/ui/1.11.4/jquery-ui.js"></script> <script src="https://rawgit.com/jmosbech/Sticky Table Headers/master/js/jquery.stickytableheaders.min.js"></script> <script type="text/javascript" src="https://www.gstatic.com/charts/loader.js"></script> <script type="text/javascript"> google.charts.load('current', {'packages':['corechart']}); // Load the Visualization API and the corechart package. google.charts.set On Load Callback(first Load); // Set a callback to run when the Google Visualization API is loaded. var burette Vol = 0; var init Mol = -1; var tot Vol = 0; function create SVG(n,a,b){ var xmlns = "http://www.w3.org/2000/svg"; var e = document.create Element NS (xmlns, n); for(var k in a){ e.set Attribute NS (null, k,a[k]); } for(var k in b){ e.set Attribute (k,b[k]); } return e; }; function first Load() { $(document).ready( function() { $("#titable tbody").html( $("#titable tbody").html() + "<tr><td>" + burette Vol.to Fixed(2) + "</td><td>" + calculate PH().to Fixed(2) + "</td><td>" + tot Vol.to Fixed(2) + "</td></tr>"); update Neutralisation(); $('#titable').sticky Table Headers({ scrollable Area: $('#titable').parent() , fixed Offset:-30 }); $( "#acid Slider" ).slider({ value:100, min: 5, max: 200, step: 5, slide: function( event, ui ) { set Float("aconc", ui.value / 100); }, stop: function( event, ui ) { update Neutralisation(); } }); $( "#base Slider" ).slider({ value:100, min: 5, max: 200, step: 5, slide: function( event, ui ) { set Float("bconc", ui.value / 100); }, stop: function( event, ui ) { update Neutralisation(); } }); $( "#stop TSlider" ).slider({ value:500, min: 10, max: 500, step: 10, slide: function( event, ui ) { set Float("stopt", ui.value / 10); } }); page Loaded = true; }); } function draw Chart() { // Create the data table. var data = new google.visualization.Data Table(); data.add Column('number', 'Volume'); data.add Column('number', 'p H'); var rows = $("#titable tbody tr"); for (i = 0; i < rows.length; i++) data.add Row([ parse Float($( rows[i] ).children()[0].inner HTML), parse Float( $( rows[i] ).children()[1].inner HTML ) ]); // Set chart options var options = { h Axis: { title: 'Volume of weak acid added / cm3', title Text Style: {color: '#FF0000', bold: 1, italic: 0, font Size: 20, font Name: 'Lucida Sans Unicode' }, view Window: { min: 0, max: 50 }, ticks: [0, 5, 10, 15, 20, 25, 30, 35, 40, 45, 50]}, v Axis: { title: 'p H', title Text Style: {color: '#FF0000', bold: 1, italic: 0, font Size: 20, font Name: 'Lucida Sans Unicode' }, view Window: { min: 0, max: 14 }, ticks: [0,1,2,3,4,5,6,7,8,9,10,11,12,13,14] }, 'chart Area': { top: 20 }, 'legend': {position: 'none'}, 'width':700, 'height':450, line Width: 3, colors: ['black'] }; // Instantiate and draw our chart, passing in some options. var chart = new google.visualization.Line Chart(document.get Element By Id('chart_div')); google.visualization.events.add Listener(chart, 'ready', function() { var gradient = create SVG('linear Gradient', {x1:0,y1:0, x2:0, y1:1}, {id:'fx'}); document.get Element By Id("chart_div").query Selector('svg>defs').append Child(gradient); gradient.append Child(create SVG('stop',{offset:'0%'})); gradient.append Child(create SVG('stop',{offset:'25%'})); gradient.append Child(create SVG('stop',{offset:'50%'})); gradient.append Child(create SVG('stop',{offset:'100%'})); $("svg").find("[clip-path]").parent().find("rect").first().attr("fill", "url(#fx)").attr("fill-opacity", "1"); change Chart Color($("#indtype").val()); }); function select Handler() { var selected Item = chart.get Selection()[0]; if (selected Item) { var p X = data.get Value(selected Item.row, 0).to Fixed(2); var p Y = data.get Value(selected Item.row, 1).to Fixed(2); $("#p X").val(p X); $("#p Y").val(p Y); } } google.visualization.events.add Listener(chart, 'select', select Handler); chart.draw(data, options) } function get Float(id) { return parse Float( $("#"+id).val() ); } function set Float(id, v) { $("#"+id).val( parse Float(v).to Fixed(2) ) ; } function calculatep Ka() { var x = (- Math.log10(get Float("Ka"))).to Fixed(2); $("#p Ka").val(x); if(get Float("p Ka")<2 || get Float("p Ka")>10) {alert("check Ka value, use scientific notation");} } function p HWA() { return -Math.log10(Math.sqrt( get Float("Ka") * get Float("aconc") )); } function p HAB(conc A, conc S) { return -Math.log10(get Float("Ka")) + (Math.log10(conc S/conc A)); } //not tested function p HWB(conc) { return 14+Math.log10(Math.sqrt(1e-14/get Float("Ka")*conc)); } function p HSB(conc) { return 14 + Math.log10(conc) } function calculate PH() { if ( burette Vol.to Fixed(2) == 0 ) { return p HSB(get Float("bconc") * get Float("btype")); } else if (burette Vol.to Fixed(2) == get Float("avol").to Fixed(2) ) { return p HWB(init Mol/tot Vol); } else if (burette Vol < get Float("avol") ) { return p HSB( (init Mol - burette Vol * get Float("aconc") ) / tot Vol ); } else if (burette Vol > get Float("avol") ) { return p HAB( ( burette Vol * get Float("aconc") - init Mol ) , init Mol ); } } function init Vars() { init Mol = get Float("bconc") * get Float("bvol") * get Float("btype"); tot Vol = get Float("bvol"); burette Vol = 0; } function titrate Step() { if (init Mol == -1) init Vars(); burette Vol += get Float("inc"); tot Vol += get Float("inc"); $("#titable tbody").html( $("#titable tbody").html() + "<tr><td>" + burette Vol.to Fixed(2) + "</td><td>" + calculate PH().to Fixed(2) + "</td><td>" + tot Vol.to Fixed(2) + "</td></tr>"); $("#titable").parent().scroll Top( $("#titable").height() ) } function update Neutralisation() { $("#avol").val( ( get Float("bvol") * get Float("bconc") * get Float("btype") / get Float("aconc") ).to Fixed(2) ); if (get Float("avol") > 50) {alert("Titre volume cannot exceed maximum capacity of burette!");} else if (get Float("avol") < 15) {alert("Titre volume too small, leads to large percentage error!");} reset Titrate(); } function auto Titrate() { while ( burette Vol < get Float("stopt")) { titrate Step(); } } function reset Titrate() { $("#titable tbody").html( "" ) draw Chart(); init Vars(); $("#titable tbody").html( $("#titable tbody").html() + "<tr><td>" + burette Vol.to Fixed(2) + "</td><td>" + calculate PH().to Fixed(2) + "</td><td>" + tot Vol.to Fixed(2) + "</td></tr>"); } var chart Col = {'0': ["white", "white", "white", "white"], '1': ["red", "orange", "#ffff33", "#ffff33"], '2': ["#990099", "grey", "#009933", "#009933"], '3': ["white", "white", "white","fuchsia"], '4': ["white", "white", "white","#2c5ba5"], }; function change Chart Color(ind Type) { $("#fx stop:nth-child(1)").css("stop-color",chart Col[ind Type][0]) $("#fx stop:nth-child(2)").css("stop-color",chart Col[ind Type][1]) $("#fx stop:nth-child(3)").css("stop-color",chart Col[ind Type][2]) $("#fx stop:nth-child(4)").css("stop-color",chart Col[ind Type][3]) } function check Boxes() { if (get Float("p X") == 0 && $("#WA").prop('checked')==false && $("#BS").prop('checked')==false && $("#SB").prop('checked')==true) {alert("Good job!");} else if (get Float("p X") < get Float("avol") && get Float("p X") > 0 && $("#WA").prop('checked')==false && $("#BS").prop('checked')==true && $("#SB").prop('checked')==true) {alert("Good job!");} else if (get Float("p X") > get Float("avol") && $("#WA").prop('checked')==true && $("#BS").prop('checked')==true && $("#SB").prop('checked')==false) {alert("Good job!");} else if (get Float("p X") == get Float("avol") && $("#WA").prop('checked')==false && $("#BS").prop('checked')==true && $("#SB").prop('checked')==false) {alert("Good job!");} else {alert("Please try again.");} } function check Buffer() { if ( get Float("p Y") > (get Float("p Ka")-1) && get Float("p Y") < (get Float("p Ka")+1) ) { if($("#buffer").prop('checked')==true) {alert("Good job!");} else {alert("Please try again. What are the 2 components required in large excess to form a buffer?");} } if (get Float("p Y") < (get Float("p Ka")-1) || get Float("p Y") > (get Float("p Ka")+1)) { if($("#buffer").prop('checked')==false) {alert("Good job!");} else {alert("Please try again. What are the 2 components required in large excess to form a buffer?");} } } </script> <body> <ul> <li><a class="active" a href="index.html">Introduction</a></li> <li><a href="SASB.html">Strong Acid - Strong Base</a></li> <li><a href="SBSA.html">Strong Base - Strong Acid</a></li> <li><a href="WASB.html">Weak Acid - Strong Base</a></li> <li><a href="WBSA.html">Weak Base - Strong Acid</a></li> <li><a href="SBWA.html">Strong Base - Weak Acid</a></li> <li><a href="SAWB.html">Strong Acid - Weak Base</a></li> </ul> <div class="hover_img"> <p style="font-size:20px"><b>Titration Curve of Strong Base against Weak Acid</b> <a href="#">(image)<span><img src="SBWA.png" height=500 border=2 ></span></a></p> </div> <table id='main Table' border=0 cellspacing=5 cellpadding=5> <tr><td><table cellpadding=5 width="20%"> <tr><td colspan=3 class='titlebg'>Set Titration Parameters</td></tr> <tr><td>[base] = </td><td><input type='input' onchange='update Neutralisation()' class='inputbg box'size="10" id='bconc' value="1.00"/><br /><div id="base Slider"></td><td>mol dm-3</td></tr> <tr><td>Strong base is</td><td colspan=2><select id='btype' class='inputbg box' onchange='update Neutralisation()'> <option value=1>monoprotic</option> <option value=2>diprotic</option></select></td></tr> <tr><td width="10%">[acid] = </td><td><input type='input' onchange='update Neutralisation()' class='inputbg box' size="10" id='aconc' value="1.00" /><br /><div id="acid Slider"></td><td>mol dm-3</td></tr> <tr><td>Ka (scientific notation) = </td><td><input type='input'class='inputbg box' size="10" id='Ka' value="1.80e-5" onchange='calculatep Ka(); update Neutralisation()' /></td><td>mol dm-3</td></tr> <tr><td>p Ka = </td><td><input type='input' class='box'size="10" id='p Ka' value="4.74" disabled /></td></tr> <tr><td>Vol of strong base in conical flask</td><td><select id='bvol' class='inputbg box' onchange="update Neutralisation();"> <option value=25>25.0</option> <option value=10>10.0</option></select></td><td>cm3</td></tr> <tr><td>Vol of weak acid req for complete neutralisation</td><td><input type='input'class='box' size="10" id='avol' value="25.00" disabled /></td><td>cm3</td></tr> <tr><td>Choice of indicator</td><td colspan=2><select id='indtype' class='inputbg box' onchange='change Chart Color(this.value)'> <option value='0'>no indicator</option> <option value='1'>methyl orange</option> <option value='2'>screened methyl orange</option> <option value='3'>phenolphthalein</option> <option value='4'>thymolphthalein</option></select></td></tr> <tr><td>Data points in increments of</td><td><select id='inc' class='inputbg box' value="1.00"> <option value=1.00>1.00</option> <option value=0.50>0.50</option> <option value=0.05>0.05 (1 drop)</option></select></td><td>cm3</td></tr> <tr><td colspan=3></td></tr> <tr><td>Stop titration at (for auto titration only)</td><td><input type='input' onchange='update Neutralisation()' class='inputbg box' size="10" id='stopt' value="50.00" /><br /><div id="stop TSlider"></td><td>cm3</td></tr> <tr><td colspan=3></td></tr> <tr> <td><input type='button' class='button greenbg' value="Do Titration Stepwise" onclick='titrate Step(); draw Chart()'></input></td> <td><input type='button' class='button redbg' value="Auto Titration" onclick='auto Titrate(); draw Chart()'></input></td> <td><input type='button' class='button' value="Reset" onclick='reset Titrate();'></input></td> </tr> </table></td> <td align=center><div id="chart_div"></div> <p class='titlebg'>Selected Point</p> Burette Volume <input type='input' class='box' size="6" id='p X' value="0.00" disabled /> p H <input type='input' class='box' size="6" id='p Y' value="0.00" disabled /><br> Select the major species present in the conical flask<br> <input type="checkbox" id="SB" value="0"> SB <input type="checkbox" id="BS" value="0"> conj base of WA <input type="checkbox" id="WA" value="0"> xs WA <input type="submit" value="Check" onclick='check Boxes()'><br> Is solution a buffer? <input type="checkbox" id="buffer" value="0"> yes <input type="submit" value="Check" onclick='check Buffer()'> </b> </td> <td> <div style='overflow:scroll; width: 200px; height:550px'> <table id="titable"> <thead><th>Burette Vol</th><th>p H</th><th>Tot Vol</th></thead> <tbody></tbody> </tabl <html> <style type='text/css'> p {font-family: "Lucida Sans Unicode", "Lucida Grande", sans-serif; margin-top: 20px; margin-left:20px;} #main Table { width: 100%; font-family: "Lucida Sans Unicode", "Lucida Grande", sans-serif} #main Table td { vertical-align:top; font-size: 10pt; } .button { font-family: "Lucida Sans Unicode", "Lucida Grande", sans-serif; font-size: 120%; padding: 10px; width: 100% } .box { font-family: "Lucida Sans Unicode", "Lucida Grande", sans-serif; font-size: 100%; padding: 2px; } #titable th { padding: 5px; margin: 5px;} #titable td { text-align : center } .greenbg { background-color:66FF66 } .redbg { background-color:pink } .inputbg { background-color:FFFF00 } .titlebg { background-color:ccddff; font-weight: bold; line-height: 200%; text-align : center; padding: 5px; margin: 5px; width: 500px} #fx stop:nth-child(1){ stop-color: white; } #fx stop:nth-child(2){ stop-color: white; } #fx stop:nth-child(3){ stop-color: white; } ul {list-style-type: none;margin: 0;padding: 0;overflow: hidden;background-color: ccddff;} li {font-family: "Lucida Sans Unicode", "Lucida Grande", sans-serif; font-size: 80%; float: left;} li a, .dropbtn { display: inline-block; color: black; font-weight: bold; text-align: center; padding: 14px 16px; text-decoration: none; } li a:hover, .dropdown:hover .dropbtn {background-color: 99b3ff;} .hover_img a { position:relative;} .hover_img a span { position:absolute; display:none; z-index:99; background-color: ffffff; left:50%; -webkit-transform: translate X(-50%); -ms-transform: translate X(-50%); transform: translate X(-50%);} .hover_img a:hover span { display:block; } </style> <link rel="stylesheet" href="https://code.jquery.com/ui/1.11.4/themes/smoothness/jquery-ui.css"> <script src="https://ajax.googleapis.com/ajax/libs/jquery/2.2.2/jquery.min.js"></script> <script src="https://code.jquery.com/ui/1.11.4/jquery-ui.js"></script> <script src="https://rawgit.com/jmosbech/Sticky Table Headers/master/js/jquery.stickytableheaders.min.js"></script> <script type="text/javascript" src="https://www.gstatic.com/charts/loader.js"></script> <script type="text/javascript"> google.charts.load('current', {'packages':['corechart']}); // Load the Visualization API and the corechart package. google.charts.set On Load Callback(first Load); // Set a callback to run when the Google Visualization API is loaded. var burette Vol = 0; var init Mol = -1; var tot Vol = 0; function create SVG(n,a,b){ var xmlns = "http://www.w3.org/2000/svg"; var e = document.create Element NS (xmlns, n); for(var k in a){ e.set Attribute NS (null, k,a[k]); } for(var k in b){ e.set Attribute (k,b[k]); } return e; }; function first Load() { $(document).ready( function() { $("#titable tbody").html( $("#titable tbody").html() + "<tr><td>" + burette Vol.to Fixed(2) + "</td><td>" + calculate PH().to Fixed(2) + "</td><td>" + tot Vol.to Fixed(2) + "</td></tr>"); update Neutralisation(); $('#titable').sticky Table Headers({ scrollable Area: $('#titable').parent() , fixed Offset:-30 }); $( "#acid Slider" ).slider({ value:100, min: 5, max: 200, step: 5, slide: function( event, ui ) { set Float("aconc", ui.value / 100); }, stop: function( event, ui ) { update Neutralisation(); } }); $( "#base Slider" ).slider({ value:100, min: 5, max: 200, step: 5, slide: function( event, ui ) { set Float("bconc", ui.value / 100); }, stop: function( event, ui ) { update Neutralisation(); } }); $( "#stop TSlider" ).slider({ value:500, min: 10, max: 500, step: 10, slide: function( event, ui ) { set Float("stopt", ui.value / 10); } }); page Loaded = true; }); } function draw Chart() { // Create the data table. var data = new google.visualization.Data Table(); data.add Column('number', 'Volume'); data.add Column('number', 'p H'); var rows = $("#titable tbody tr"); for (i = 0; i < rows.length; i++) data.add Row([ parse Float($( rows[i] ).children()[0].inner HTML), parse Float( $( rows[i] ).children()[1].inner HTML ) ]); // Set chart options var options = { h Axis: { title: 'Volume of strong base added / cm3', title Text Style: {color: '#FF0000', bold: 1, italic: 0, font Size: 20, font Name: 'Lucida Sans Unicode' }, view Window: { min: 0, max: 50 }, ticks: [0, 5, 10, 15, 20, 25, 30, 35, 40, 45, 50]}, v Axis: { title: 'p H', title Text Style: {color: '#FF0000', bold: 1, italic: 0, font Size: 20, font Name: 'Lucida Sans Unicode' }, view Window: { min: 0, max: 14 }, ticks: [0,1,2,3,4,5,6,7,8,9,10,11,12,13,14] }, 'chart Area': { top: 20 }, 'legend': {position: 'none'}, 'width':700, 'height':450, line Width: 3, colors: ['black'] }; // Instantiate and draw our chart, passing in some options. var chart = new google.visualization.Line Chart(document.get Element By Id('chart_div')); google.visualization.events.add Listener(chart, 'ready', function() { var gradient = create SVG('linear Gradient', {x1:0,y1:0, x2:0, y1:1}, {id:'fx'}); document.get Element By Id("chart_div").query Selector('svg>defs').append Child(gradient); gradient.append Child(create SVG('stop',{offset:'0%'})); gradient.append Child(create SVG('stop',{offset:'25%'})); gradient.append Child(create SVG('stop',{offset:'50%'})); gradient.append Child(create SVG('stop',{offset:'100%'})); $("svg").find("[clip-path]").parent().find("rect").first().attr("fill", "url(#fx)").attr("fill-opacity", "1"); change Chart Color($("#indtype").val()); }); function select Handler() { var selected Item = chart.get Selection()[0]; if (selected Item) { var p X = data.get Value(selected Item.row, 0).to Fixed(2); var p Y = data.get Value(selected Item.row, 1).to Fixed(2); $("#p X").val(p X); $("#p Y").val(p Y); } } google.visualization.events.add Listener(chart, 'select', select Handler); chart.draw(data, options) } function get Float(id) { return parse Float( $("#"+id).val() ); } function set Float(id, v) { $("#"+id).val( parse Float(v).to Fixed(2) ) ; } function calculatep Ka() { var x = (- Math.log10(get Float("Ka"))).to Fixed(2); $("#p Ka").val(x); if(get Float("p Ka")<2 || get Float("p Ka")>10) {alert("check Ka value, use scientific notation");} } function p HWA() { return -Math.log10(Math.sqrt( get Float("Ka") * get Float("aconc") )); } function p HAB(conc A, conc S) { return -Math.log10(get Float("Ka")) + Math.log10(conc S/conc A); } function p HWB(conc) { return 14+Math.log10(Math.sqrt(1e-14/get Float("Ka")*conc)); } function p HSB(conc) { return 14 + Math.log10(conc) } function calculate PH() { if ( burette Vol.to Fixed(2) == 0 ) { return p HWA(); } else if (burette Vol.to Fixed(2) == get Float("bvol").to Fixed(2) ) { return p HWB(init Mol/tot Vol); } else if (burette Vol < get Float("bvol") ) { return p HAB( parse Float( init Mol - burette Vol * get Float("bconc") * get Float("btype") ), parse Float(burette Vol * get Float("bconc") * get Float("btype")) ); } else if (burette Vol > get Float("bvol") ) { return p HSB( ( burette Vol * get Float("bconc") * get Float("btype") - init Mol ) / (tot Vol) ); } } function init Vars() { init Mol = get Float("aconc") * get Float("avol"); tot Vol = get Float("avol"); burette Vol = 0; } function titrate Step() { if (init Mol == -1) init Vars(); burette Vol += get Float("inc"); tot Vol += get Float("inc"); $("#titable tbody").html( $("#titable tbody").html() + "<tr><td>" + burette Vol.to Fixed(2) + "</td><td>" + calculate PH().to Fixed(2) + "</td><td>" + tot Vol.to Fixed(2) + "</td></tr>"); } function update Neutralisation() { set Float("bvol", (( get Float("avol") * get Float("aconc") ) / ( get Float("btype") * get Float("bconc")))); if (get Float("bvol") > 50) {alert("Titre volume cannot exceed maximum capacity of burette!");} else if (get Float("bvol") < 15) {alert("Titre volume too small, leads to large percentage error!");} reset Titrate(); } function auto Titrate() { while ( burette Vol < get Float("stopt")) { titrate Step(); } } function reset Titrate() { $("#titable tbody").html( "" ) draw Chart(); init Vars(); $("#titable tbody").html( $("#titable tbody").html() + "<tr><td>" + burette Vol.to Fixed(2) + "</td><td>" + calculate PH().to Fixed(2) + "</td><td>" + tot Vol.to Fixed(2) + "</td></tr>"); } var chart Col = {'0': ["white", "white", "white", "white"], '1': ["red", "orange", "#ffff33", "#ffff33"], '2': ["#990099", "grey", "#009933", "#009933"], '3': ["white", "white", "white","fuchsia"], '4': ["white", "white", "white","#2c5ba5"], }; function change Chart Color(ind Type) { $("#fx stop:nth-child(1)").css("stop-color",chart Col[ind Type][0]) $("#fx stop:nth-child(2)").css("stop-color",chart Col[ind Type][1]) $("#fx stop:nth-child(3)").css("stop-color",chart Col[ind Type][2]) $("#fx stop:nth-child(4)").css("stop-color",chart Col[ind Type][3]) } function check Boxes() { if (get Float("p X") == 0 && $("#WA").prop('checked')==true && $("#BS").prop('checked')==false && $("#SB").prop('checked')==false) {alert("Good job!");} else if (get Float("p X") < get Float("bvol") && get Float("p X") > 0 && $("#WA").prop('checked')==true && $("#BS").prop('checked')==true && $("#SB").prop('checked')==false) {alert("Good job!");} else if (get Float("p X") > get Float("bvol") && $("#WA").prop('checked')==false && $("#BS").prop('checked')==true && $("#SB").prop('checked')==true) {alert("Good job!");} else if (get Float("p X") == get Float("bvol") && $("#WA").prop('checked')==false && $("#BS").prop('checked')==true && $("#SB").prop('checked')==false) {alert("Good job!");} else {alert("Please try again.");} } function check Buffer() { if ( get Float("p Y") > (get Float("p Ka")-1) && get Float("p Y") < (get Float("p Ka")+1) ) { if($("#buffer").prop('checked')==true) {alert("Good job!");} else {alert("Please try again. What are the 2 components required in large excess to form a buffer?");} } if (get Float("p Y") < (get Float("p Ka")-1) || get Float("p Y") > (get Float("p Ka")+1)) { if($("#buffer").prop('checked')==false) {alert("Good job!");} else {alert("Please try again. What are the 2 components required in large excess to form a buffer?");} } } </script> <body> <ul> <li><a class="active" a href="index.html">Introduction</a></li> <li><a href="SASB.html">Strong Acid - Strong Base</a></li> <li><a href="SBSA.html">Strong Base - Strong Acid</a></li> <li><a href="WASB.html">Weak Acid - Strong Base</a></li> <li><a href="WBSA.html">Weak Base - Strong Acid</a></li> <li><a href="SBWA.html">Strong Base - Weak Acid</a></li> <li><a href="SAWB.html">Strong Acid - Weak Base</a></li> </ul> <div class="hover_img"> <p style="font-size:20px"><b>Titration Curve of Weak Acid against Strong Base</b> <a href="#">(image)<span><img src="WASB.png" height=500 border=2 ></span></a></p> </div> <table id='main Table' border=0 cellspacing=5 cellpadding=5> <tr><td><table cellpadding=5 width="20%"> <tr><td colspan=3 class='titlebg'>Set Titration Parameters</td></tr> <tr><td width="10%">[acid] = </td><td><input type='input' onchange='update Neutralisation()' class='inputbg box' size="10" id='aconc' value="1.00" /><br /><div id="acid Slider"></td><td>mol dm-3</td></tr> <tr><td>Ka (scientific notation) = </td><td><input type='input'class='inputbg box' size="10" id='Ka' value="1.80e-5" onchange='calculatep Ka(); update Neutralisation()' /></td><td>mol dm-3</td></tr> <tr><td>p Ka = </td><td><input type='input' class='box'size="10" id='p Ka' value="4.74" disabled /></td></tr> <tr><td>[base] = </td><td><input type='input' onchange='update Neutralisation()' class='inputbg box'size="10" id='bconc' value="1.00"/><br /><div id="base Slider"></td><td>mol dm-3</td></tr> <tr><td>Strong base is</td><td colspan=2><select id='btype' class='inputbg box' onchange='update Neutralisation()'> <option value=1>monoprotic</option> <option value=2>diprotic</option></select></td></tr> <tr><td>Vol of weak acid in conical flask</td><td><select id='avol' class='inputbg box' onchange="update Neutralisation();"> <option value=25>25.0</option> <option value=10>10.0</option></select></td><td>cm3</td></tr> <tr><td>Vol of strong base req for complete neutralisation</td><td><input type='input'class='box' size="10" id='bvol' value="25.00" disabled /></td><td>cm3</td></tr> <tr><td>Choice of indicator</td><td colspan=2><select id='indtype' class='inputbg box' onchange='change Chart Color(this.value)'> <option value='0'>no indicator</option> <option value='1'>methyl orange</option> <option value='2'>screened methyl orange</option> <option value='3'>phenolphthalein</option> <option value='4'>thymolphthalein</option></select></td></tr> <tr><td>Data points in increments of</td><td><select id='inc' class='inputbg box' value="1.00"> <option value=1.00>1.00</option> <option value=0.50>0.50</option> <option value=0.05>0.05 (1 drop)</option></select></td><td>cm3</td></tr> <tr><td colspan=3></td></tr> <tr><td>Stop titration at (for auto titration only)</td><td><input type='input' onchange='update Neutralisation()' class='inputbg box' size="10" id='stopt' value="50.00" /><br /><div id="stop TSlider"></td><td>cm3</td></tr> <tr><td colspan=3></td></tr> <tr> <td><input type='button' class='button greenbg' value="Do Titration Stepwise" onclick='titrate Step(); draw Chart()'></input></td> <td><input type='button' class='button redbg' value="Auto Titration" onclick='auto Titrate(); draw Chart()'></input></td> <td><input type='button' class='button' value="Reset" onclick='reset Titrate();'></input></td> </tr> </table></td> <td align=center><div id="chart_div"></div> <p class='titlebg'>Selected Point</p> Burette Volume <input type='input' class='box' size="6" id='p X' value="0.00" disabled /> p H <input type='input' class='box' size="6" id='p Y' value="0.00" disabled /><br> Select the major species present in the conical flask<br> <input type="checkbox" id="WA" value="0"> WA <input type="checkbox" id="BS" value="0"> conj base of WA <input type="checkbox" id="SB" value="0"> xs SB <input type="submit" value="Check" onclick='check Boxes()'><br> Is solution a buffer? <input type="checkbox" id="buffer" value="0"> yes <input type="submit" value="Check" onclick='check Buffer()'> </b> </td> <td> <div style='overflow:scroll; width: 200px; height:550px'> <table id="titable"> <thead><th>Burette Vol</th><th>p H</th><th>Tot Vol</th></thead> <tbody></tbody> </table> </div> </td> </tr> <html> <style type='text/css'> p {font-family: "Lucida Sans Unicode", "Lucida Grande", sans-serif; margin-top: 20px; margin-left:20px;} #main Table { width: 100%; font-family: "Lucida Sans Unicode", "Lucida Grande", sans-serif} #main Table td { vertical-align:top; font-size: 10pt; } .button { font-family: "Lucida Sans Unicode", "Lucida Grande", sans-serif; font-size: 120%; padding: 10px; width: 100% } .box { font-family: "Lucida Sans Unicode", "Lucida Grande", sans-serif; font-size: 100%; padding: 2px; } #titable th { padding: 5px; margin: 5px;} #titable td { text-align : center } .greenbg { background-color:66FF66 } .redbg { background-color:pink } .inputbg { background-color:FFFF00 } .titlebg { background-color:ccddff; font-weight: bold; line-height: 200%; text-align : center; padding: 5px; margin: 5px; width: 500px} #fx stop:nth-child(1){ stop-color: white; } #fx stop:nth-child(2){ stop-color: white; } #fx stop:nth-child(3){ stop-color: white; } ul {list-style-type: none;margin: 0;padding: 0;overflow: hidden;background-color: ccddff;} li {font-family: "Lucida Sans Unicode", "Lucida Grande", sans-serif; font-size: 80%; float: left;} li a, .dropbtn { display: inline-block; color: black; font-weight: bold; text-align: center; padding: 14px 16px; text-decoration: none; } li a:hover, .dropdown:hover .dropbtn {background-color: 99b3ff;} .hover_img a { position:relative;} .hover_img a span { position:absolute; display:none; z-index:99; background-color: ffffff; left:50%; -webkit-transform: translate X(-50%); -ms-transform: translate X(-50%); transform: translate X(-50%);} .hover_img a:hover span { display:block; } </style> <link rel="stylesheet" href="https://code.jquery.com/ui/1.11.4/themes/smoothness/jquery-ui.css"> <script src="https://ajax.googleapis.com/ajax/libs/jquery/2.2.2/jquery.min.js"></script> <script src="https://code.jquery.com/ui/1.11.4/jquery-ui.js"></script> <script src="https://rawgit.com/jmosbech/Sticky Table Headers/master/js/jquery.stickytableheaders.min.js"></script> <script type="text/javascript" src="https://www.gstatic.com/charts/loader.js"></script> <script type="text/javascript"> google.charts.load('current', {'packages':['corechart']}); // Load the Visualization API and the corechart package. google.charts.set On Load Callback(first Load); // Set a callback to run when the Google Visualization API is loaded. var burette Vol = 0; var init Mol = -1; var tot Vol = 0; function create SVG(n,a,b){ var xmlns = "http://www.w3.org/2000/svg"; var e = document.create Element NS (xmlns, n); for(var k in a){ e.set Attribute NS (null, k,a[k]); } for(var k in b){ e.set Attribute (k,b[k]); } return e; }; function first Load() { $(document).ready( function() { $("#titable tbody").html( $("#titable tbody").html() + "<tr><td>" + burette Vol.to Fixed(2) + "</td><td>" + calculate PH().to Fixed(2) + "</td><td>" + tot Vol.to Fixed(2) + "</td></tr>"); update Neutralisation(); $('#titable').sticky Table Headers({ scrollable Area: $('#titable').parent() , fixed Offset:-30 }); $( "#acid Slider" ).slider({ value:100, min: 5, max: 200, step: 5, slide: function( event, ui ) { set Float("aconc", ui.value / 100); }, stop: function( event, ui ) { update Neutralisation(); } }); $( "#base Slider" ).slider({ value:100, min: 5, max: 200, step: 5, slide: function( event, ui ) { set Float("bconc", ui.value / 100); }, stop: function( event, ui ) { update Neutralisation(); } }); $( "#stop TSlider" ).slider({ value:500, min: 10, max: 500, step: 10, slide: function( event, ui ) { set Float("stopt", ui.value / 10); } }); page Loaded = true; }); } function draw Chart() { // Create the data table. var data = new google.visualization.Data Table(); data.add Column('number', 'Volume'); data.add Column('number', 'p H'); var rows = $("#titable tbody tr"); for (i = 0; i < rows.length; i++) data.add Row([ parse Float($( rows[i] ).children()[0].inner HTML), parse Float( $( rows[i] ).children()[1].inner HTML ) ]); // Set chart options var options = { h Axis: { title: 'Volume of strong acid added / cm3', title Text Style: {color: '#FF0000', bold: 1, italic: 0, font Size: 20, font Name: 'Lucida Sans Unicode' }, view Window: { min: 0, max: 50 }, ticks: [0, 5, 10, 15, 20, 25, 30, 35, 40, 45, 50]}, v Axis: { title: 'p H', title Text Style: {color: '#FF0000', bold: 1, italic: 0, font Size: 20, font Name: 'Lucida Sans Unicode' }, view Window: { min: 0, max: 14 }, ticks: [0,1,2,3,4,5,6,7,8,9,10,11,12,13,14] }, 'chart Area': { top: 20 }, 'legend': {position: 'none'}, 'width':700, 'height':450, line Width: 3, colors: ['black'] }; // Instantiate and draw our chart, passing in some options. var chart = new google.visualization.Line Chart(document.get Element By Id('chart_div')); google.visualization.events.add Listener(chart, 'ready', function() { var gradient = create SVG('linear Gradient', {x1:0,y1:0, x2:0, y1:1}, {id:'fx'}); document.get Element By Id("chart_div").query Selector('svg>defs').append Child(gradient); gradient.append Child(create SVG('stop',{offset:'0%'})); gradient.append Child(create SVG('stop',{offset:'25%'})); gradient.append Child(create SVG('stop',{offset:'50%'})); gradient.append Child(create SVG('stop',{offset:'100%'})); $("svg").find("[clip-path]").parent().find("rect").first().attr("fill", "url(#fx)").attr("fill-opacity", "1"); change Chart Color($("#indtype").val()); }); function select Handler() { var selected Item = chart.get Selection()[0]; if (selected Item) { var p X = data.get Value(selected Item.row, 0).to Fixed(2); var p Y = data.get Value(selected Item.row, 1).to Fixed(2); $("#p X").val(p X); $("#p Y").val(p Y); } } google.visualization.events.add Listener(chart, 'select', select Handler); chart.draw(data, options) } function get Float(id) { return parse Float( $("#"+id).val() ); } function set Float(id, v) { $("#"+id).val( parse Float(v).to Fixed(2) ) ; } function calculatep Kb() { var x = (-Math.log10(get Float("Kb"))).to Fixed(2); $("#p Kb").val(x); if(get Float("p Kb")<2 || get Float("p Kb")>10) {alert("check Kb value, use scientific notation");} } function p HWB() { return 14 + Math.log10(Math.sqrt( get Float("Kb") * get Float("bconc") )); } function p HBB(conc B, conc S) { return 14 - (-Math.log10(get Float("Kb")) + (Math.log10(conc S/conc B))); } function p HWA(conc) { return -Math.log10(Math.sqrt(1e-14/get Float("Kb")*conc)); } function p HSA(conc) { return -Math.log10(conc) } function calculate PH() { if ( burette Vol.to Fixed(2) == 0 ) { return p HWB(); } else if (burette Vol.to Fixed(2) == get Float("avol").to Fixed(2) ) { return p HWA(init Mol/tot Vol); } else if (burette Vol < get Float("avol") ) { return p HBB( ( init Mol - burette Vol * get Float("aconc") * get Float("atype") ), (burette Vol * get Float("aconc") * get Float("atype")) ); } else if (burette Vol > get Float("avol") ) { return p HSA( ( burette Vol * get Float("aconc") * get Float("atype") - init Mol ) / (tot Vol) ); } } function init Vars() { init Mol = get Float("bconc") * get Float("bvol"); tot Vol = get Float("bvol"); burette Vol = 0; } function titrate Step() { if (init Mol == -1) init Vars(); burette Vol += get Float("inc"); tot Vol += get Float("inc"); $("#titable tbody").html( $("#titable tbody").html() + "<tr><td>" + burette Vol.to Fixed(2) + "</td><td>" + calculate PH().to Fixed(2) + "</td><td>" + tot Vol.to Fixed(2) + "</td></tr>"); $("#titable").parent().scroll Top( $("#titable").height() ) } function update Neutralisation() { $("#avol").val( ( ( get Float("bvol") * get Float("bconc") ) / ( get Float("atype") * get Float("aconc") ) ).to Fixed(2) ); if (get Float("avol") > 50) {alert("Titre volume cannot exceed maximum capacity of burette!");} else if (get Float("avol") < 15) {alert("Titre volume too small, leads to large percentage error!");} reset Titrate(); } function auto Titrate() { while ( burette Vol < get Float("stopt")) { titrate Step(); } } function reset Titrate() { $("#titable tbody").html( "" ) draw Chart(); init Vars(); $("#titable tbody").html( $("#titable tbody").html() + "<tr><td>" + burette Vol.to Fixed(2) + "</td><td>" + calculate PH().to Fixed(2) + "</td><td>" + tot Vol.to Fixed(2) + "</td></tr>"); } var chart Col = {'0': ["white", "white", "white", "white"], '1': ["red", "orange", "#ffff33", "#ffff33"], '2': ["#990099", "grey", "#009933", "#009933"], '3': ["white", "white", "white","fuchsia"], '4': ["white", "white", "white","#2c5ba5"], }; function change Chart Color(ind Type) { $("#fx stop:nth-child(1)").css("stop-color",chart Col[ind Type][0]) $("#fx stop:nth-child(2)").css("stop-color",chart Col[ind Type][1]) $("#fx stop:nth-child(3)").css("stop-color",chart Col[ind Type][2]) $("#fx stop:nth-child(4)").css("stop-color",chart Col[ind Type][3]) } function check Boxes() { if (get Float("p X") == 0 && $("#WB").prop('checked')==true && $("#AS").prop('checked')==false && $("#SA").prop('checked')==false) {alert("Good job!");} else if (get Float("p X") < get Float("avol") && get Float("p X") > 0 && $("#WB").prop('checked')==true && $("#AS").prop('checked')==true && $("#SA").prop('checked')==false) {alert("Good job!");} else if (get Float("p X") > get Float("avol") && $("#WB").prop('checked')==false && $("#AS").prop('checked')==true && $("#SA").prop('checked')==true) {alert("Good job!");} else if (get Float("p X") == get Float("avol") && $("#WB").prop('checked')==false && $("#AS").prop('checked')==true && $("#SA").prop('checked')==false) {alert("Good job!");} else {alert("Please try again.");} } function check Buffer() { if ( (14-get Float("p Y")) > (get Float("p Kb")-1) && (14-get Float("p Y")) < (get Float("p Kb")+1) ) { if($("#buffer").prop('checked')==true) {alert("Good job!");} else {alert("Please try again. What are the 2 components required in large excess to form a buffer?");} } else if ( (14-get Float("p Y")) < (get Float("p Kb")-1) || (14-get Float("p Y")) > (get Float("p Kb")+1) ) { if($("#buffer").prop('checked')==false) {alert("Good job!");} else {alert("Please try again. What are the 2 components required in large excess to form a buffer?");} } } </script> <body> <ul> <li><a class="active" a href="index.html">Introduction</a></li> <li><a href="SASB.html">Strong Acid - Strong Base</a></li> <li><a href="SBSA.html">Strong Base - Strong Acid</a></li> <li><a href="WASB.html">Weak Acid - Strong Base</a></li> <li><a href="WBSA.html">Weak Base - Strong Acid</a></li> <li><a href="SBWA.html">Strong Base - Weak Acid</a></li> <li><a href="SAWB.html">Strong Acid - Weak Base</a></li> </ul> <div class="hover_img"> <p style="font-size:20px"><b>Titration Curve of Weak Base against Strong Acid</b> <a href="#">(image)<span><img src="WBSA.png" height=500 border=2 ></span></a></p> </div> <table id='main Table' border=0 cellspacing=5 cellpadding=5> <tr><td><table cellpadding=5 width="20%"> <tr><td colspan=3 class='titlebg'>Set Titration Parameters</td></tr> <tr><td width="10%">[base] = </td><td><input type='input' onchange='update Neutralisation()' class='inputbg box' size="10" id='bconc' value="1.00" /><br /><div id="base Slider"></td><td>mol dm-3</td></tr> <tr><td>Kb (scientific notation) = </td><td><input type='input'class='inputbg box' size="10" id='Kb' value="1.80e-5" onchange='calculatep Kb(); update Neutralisation()' /></td><td>mol dm-3</td></tr> <tr><td>p Kb = </td><td><input type='input' class='box'size="10" id='p Kb' value="4.74" disabled /></td></tr> <tr><td>[acid] = </td><td><input type='input' onchange='update Neutralisation()' class='inputbg box'size="10" id='aconc' value="1.00"/><br /><div id="acid Slider"></td><td>mol dm-3</td></tr> <tr><td>Strong acid is</td><td colspan=2><select id='atype' class='inputbg box' onchange='update Neutralisation()'> <option value=1>monoprotic</option> <option value=2>diprotic</option></select></td></tr> <tr><td>Vol of weak base in conical flask</td><td><select id='bvol' class='inputbg box' onchange="update Neutralisation();"> <option value=25>25.0</option> <option value=10>10.0</option></select></td><td>cm3</td></tr> <tr><td>Vol of strong acid req for complete neutralisation</td><td><input type='input'class='box' size="10" id='avol' value="25.00" disabled /></td><td>cm3</td></tr> <tr><td>Choice of indicator</td><td colspan=2><select id='indtype' class='inputbg box' onchange='change Chart Color(this.value)'> <option value='0'>no indicator</option> <option value='1'>methyl orange</option> <option value='2'>screened methyl orange</option> <option value='3'>phenolphthalein</option> <option value='4'>thymolphthalein</option></select></td></tr> <tr><td>Data points in increments of</td><td><select id='inc' class='inputbg box' value="1.00"> <option value=1.00>1.00</option> <option value=0.50>0.50</option> <option value=0.05>0.05 (1 drop)</option></select></td><td>cm3</td></tr> <tr><td colspan=3></td></tr> <tr><td>Stop titration at (for auto titration only)</td><td><input type='input' onchange='update Neutralisation()' class='inputbg box' size="10" id='stopt' value="50.00" /><br /><div id="stop TSlider"></td><td>cm3</td></tr> <tr><td colspan=3></td></tr> <tr> <td><input type='button' class='button greenbg' value="Do Titration Stepwise" onclick='titrate Step(); draw Chart()'></input></td> <td><input type='button' class='button redbg' value="Auto Titration" onclick='auto Titrate(); draw Chart()'></input></td> <td><input type='button' class='button' value="Reset" onclick='reset Titrate();'></input></td> </tr> </table></td> <td align=center><div id="chart_div"></div> <p class='titlebg'>Selected Point</p> Burette Volume <input type='input' class='box' size="6" id='p X' value="0.00" disabled /> p H <input type='input' class='box' size="6" id='p Y' value="0.00" disabled /><br> Select the major species present in the conical flask<br> <input type="checkbox" id="WB" value="0"> WB <input type="checkbox" id="AS" value="0"> conj acid of WB <input type="checkbox" id="SA" value="0"> xs SA <input type="submit" value="Check" onclick='check Boxes()'><br> Is solution a buffer? <input type="checkbox" id="buffer" value="0"> yes <input type="submit" value="Check" onclick='check Buffer()'> </b> </td> <td> <div style='overflow:scroll; width: 200px; height:550px'> <table id="titable"> <thead><th>Burette Vol</th><th>p H</th><th>To

Open Index, an interactive HTML5 learning activity for chemistry.
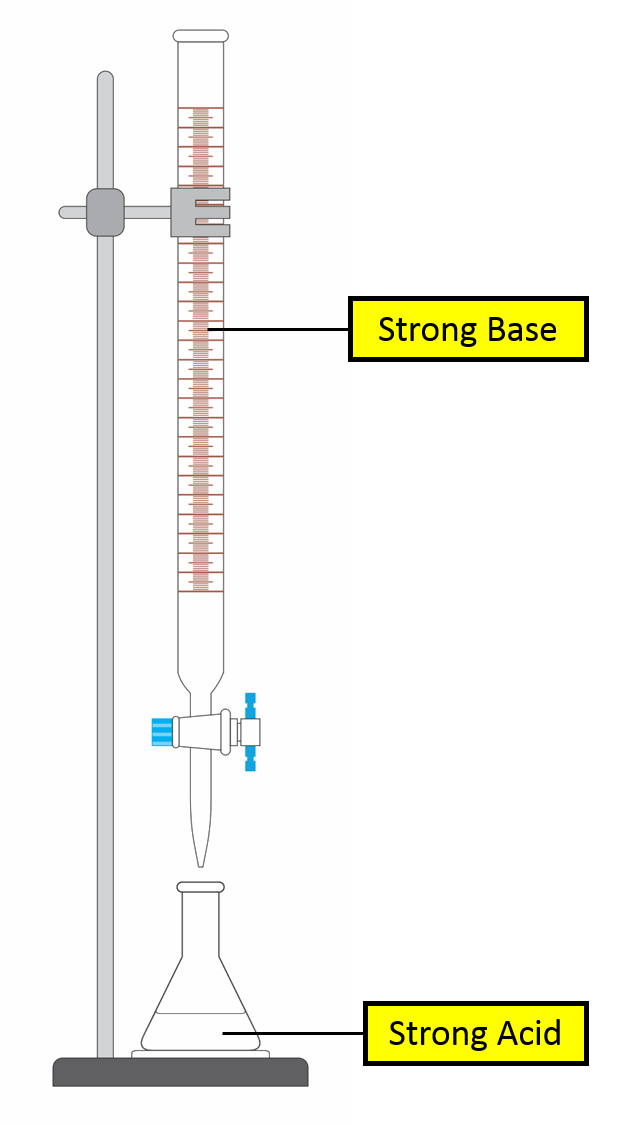
Volume of strong base added / cm3', title Text Style: {color: '#FF0000', bold: 1, italic: 0, font Size: 20, font Name: 'Lucida Sans Unicode' }, view Window: { min: 0, max: 50 }, ticks: [0, 5, 10, 15, 20, 25, 30, 35, 40, 45, 50]}, v Axis: { title: 'p H', title Text Style: {color: '#FF0000', bold: 1, italic: 0, font Size: 20, font Name: 'Lucida Sans Unicode' }, view Window: { min: 0, max: 14 }, ticks: [0,1,2,3,4,5,6,7,8,9,10,11,12,13,14] }, 'chart Area': { top: 20 }, 'legend': {position: 'none'}, 'tooltip': {is Html: true}, // This MUST be set to true for your chart to show. 'width':700, 'height':450, line Width: 3, colors: ['black'] }; // Instantiate and draw our chart, passing in some options. var chart = new google.visualization.Line Chart(document.get Element By Id('chart_div')); google.visualization.events.add Listener(chart, 'ready', function() { var gradient = create SVG('linear Gradient', {x1:0,y1:0, x2:0, y1:1}, {id:'fx'}); document.get Element By Id("chart_div").query Selector('svg>defs').append Child(gradient); gradient.append Child(create SVG('stop',{offset:'0%'})); gradient.append Child(create SVG('stop',{offset:'25%'})); gradient.append Child(create SVG('stop',{offset:'50%'})); gradient.append Child(create SVG('stop',{offset:'100%'})); $("svg").find("[clip-path]").parent().find("rect").first().attr("fill", "url(#fx)").attr("fill-opacity", "1"); change Chart Color($("#indtype").val()); }); function select Handler() { var selected Item = chart.get Selection()[0]; if (selected Item) { var p X = data.get Value(selected Item.row, 0).to Fixed(2); var p Y = data.get Value(selected Item.row, 1).to Fixed(2); $("#p X").val(p X); $("#p Y").val(p Y); } } google.visualization.events.add Listener(chart, 'select', select Handler); chart.draw(data, options) } function get Float(id) { return parse Float( $("#"+id).val() ); } function set Float(id, v) { $("#"+id).val( parse Float(v).to Fixed(2) ) ; } function p HSA(conc) { return -Math.log10(conc); } function p HSB(conc) { return 14 + Math.log10(conc) } function calculate PH() { if (burette Vol.to Fixed(2) == get Float("bvol").to Fixed(2) ) { return 7.0; } else if (burette Vol < get Float("bvol") ) { return p HSA( ( init Mol - burette Vol * get Float("bconc") * get Float("btype") ) / (tot Vol) ); } else if (burette Vol > get Float("bvol") ) { return p HSB( ( (burette Vol*get Float("bconc")*get Float("btype")-init Mol) ) / (tot Vol) ); } } function init Vars() { init Mol = get Float("aconc") * get Float("avol") * get Float("atype"); tot Vol = get Float("avol"); burette Vol = 0; tooltip Charts HTML = {}; generate Graph For Current Burette Volume(); } function generate Graph For Current Burette Volume() { var tot Acid Mol = get Float("aconc") * get Float("avol") * get Float("atype") / 1000; var acid Mol = tot Acid Mol - burette Vol * get Float("bconc") * get Float("btype") / 1000; var salt Mol = burette Vol * get Float("bconc") * get Float("btype") / 1000; if (salt Mol > tot Acid Mol) salt Mol = tot Acid Mol; var data = new google.visualization.Data Table(); data.add Column('string', 'Species Type'); data.add Column('number', 'Mols'); data.add Rows([ ["strong acid", acid Mol > 0 ? acid Mol : 0], ["salt", salt Mol], ["xs strong base", acid Mol < 0 ? -acid Mol : 0] ]); var hidden Div = document.get Element By Id('hidden_div'); var tooltip Chart = new google.visualization.Column Chart(hidden Div); var cur Burette Vol = burette Vol.to Fixed(2); // As the following function is a callback, it means that by the time it is called burette Vol may have changed. So we fixed it in a variable now google.visualization.events.add Listener(tooltip Chart, 'ready', function() { // Get the PNG of the chart and set it as the src of an img tag, to be displayed as HTML tooltip Charts HTML[cur Burette Vol] = '<img src="' + tooltip Chart.get Image URI() + '">';; }); var tooltip Options = { title: 'Amount of each species present', v Axis: { title: 'Amount / mol', title Text Style: {color: 'black', bold: 1, italic: 0, font Size: 10, font Name: 'Lucida Sans Unicode' }, view Window: { min: 0, max: get Float("aconc") * get Float("avol") * get Float("atype") / 1000 }, }, legend: {position: 'none'}, axes: { y: { 0: {label: "Amount / mol"} } } }; tooltip Chart.draw(data, tooltip Options); } function titrate Step() { if (page Loaded == false) { alert("Please wait for a while, page scripts still loading."); return; } if (init Mol == -1) init Vars(); burette Vol += get Float("inc"); tot Vol += get Float("inc"); generate Graph For Current Burette Volume( ); $("#titable tbody").html( $("#titable tbody").html() + "<tr><td>" + burette Vol.to Fixed(2) + "</td><td>" + calculate PH().to Fixed(2) + "</td><td>" + tot Vol.to Fixed(2) + "</td></tr>"); $("#titable").parent().scroll Top( $("#titable").height() ) } function update Neutralisation() { $("#bvol").val( ( ( get Float("avol") * get Float("atype") * get Float("aconc") ) / ( get Float("btype") * get Float("bconc") ) ).to Fixed(2) ); if (get Float("bvol") > 50) {alert("Titre volume cannot exceed maximum capacity of burette!");} else if (get Float("bvol") < 15) {alert("Titre volume too small, leads to large percentage error!");} reset Titrate(); } function auto Titrate() { if (page Loaded == false) { alert("Please wait for a while, page scripts still loading."); return; } if ( burette Vol < get Float("stopt")) { titrate Step(); window.set Timeout("auto Titrate()", 1); // Set a break before next function call, so that display worker gets a chance to update the display } else { draw Chart(); } } function reset Titrate() { $("#titable tbody").html( "" ) draw Chart(); init Vars(); $("#titable tbody").html( $("#titable tbody").html() + "<tr><td>" + burette Vol.to Fixed(2) + "</td><td>" + calculate PH().to Fixed(2) + "</td><td>" + tot Vol.to Fixed(2) + "</td></tr>"); } var chart Col = {'0': ["white", "white", "white", "white"], '1': ["red", "orange", "#ffff33", "#ffff33"], '2': ["#990099", "grey", "#009933", "#009933"], '3': ["white", "white", "white","fuchsia"], '4': ["white", "white", "white","#2c5ba5"], }; function change Chart Color(ind Type) { $("#fx stop:nth-child(1)").css("stop-color",chart Col[ind Type][0]) $("#fx stop:nth-child(2)").css("stop-color",chart Col[ind Type][1]) $("#fx stop:nth-child(3)").css("stop-color",chart Col[ind Type][2]) $("#fx stop:nth-child(4)").css("stop-color",chart Col[ind Type][3]) } function check Boxes() { if (get Float("p X") < get Float("bvol") && get Float("p X") > 0 && $("#SA").prop('checked')==true && $("#NS").prop('checked')==true && $("#SB").prop('checked')==false) {alert("Good job!");} else if (get Float("p X") > get Float("bvol") && $("#SA").prop('checked')==false && $("#NS").prop('checked')==true && $("#SB").prop('checked')==true) {alert("Good job!");} else if (get Float("p X") == get Float("bvol") && $("#SA").prop('checked')==false && $("#NS").prop('checked')==true && $("#SB").prop('checked')==false) {alert("Good job!");} else if (get Float("p X") == 0 && $("#SA").prop('checked')==true && $("#NS").prop('checked')==false && $("#SB").prop('checked')==false) {alert("Good job!");} else {alert("Please try again.");} } </script> <body> <ul> <li><a class="active" a href="index.html">Introduction</a></li> <li><a href="SASB.html">Strong Acid - Strong Base</a></li> <li><a href="SBSA.html">Strong Base - Strong Acid</a></li> <li><a href="WASB.html">Weak Acid - Strong Base</a></li> <li><a href="WBSA.html">Weak Base - Strong Acid</a></li> <li><a href="SBWA.html">Strong Base - Weak Acid</a></li> <li><a href="SAWB.html">Strong Acid - Weak Base</a></li> </ul> <div class="hover_img"> <p style="font-size:20px"><b>Titration Curve of Strong Acid against Strong Base</b> <a href="#">(image)<span><img src="SASB.png" height=500 border=2 ></span></a> </div> </p> <table id='main Table' border=0 cellspacing=5 cellpadding=5> <tr><td><table cellpadding=5 width="20%"> <tr><td colspan=3 class='titlebg'>Set Titration Parameters</td></tr> <tr><td width="10%">[acid] = </td><td><input type='input' onchange='update Neutralisation()' class='inputbg box' size="10" id='aconc' value="1.00" /><br /><div id="acid Slider"></td><td>mol dm-3</td></tr> <tr><td>Strong acid is</td><td colspan=2><select id='atype' class='inputbg box' onchange='update Neutralisation()'> <option value=1>monoprotic</option> <option value=2>diprotic</option></select></td></tr> <tr><td>[base] = </td><td><input type='input' onchange='update Neutralisation()' class='inputbg box'size="10" id='bconc' value="1.00"/><br /><div id="base Slider"></td><td>mol dm-3</td></tr> <tr><td>Strong base is</td><td colspan=2><select id='btype' class='inputbg box' onchange='update Neutralisation()'> <option value=1>monoprotic</option> <option value=2>diprotic</option></select></td></tr> <tr><td>Vol of strong acid in conical flask</td><td><select id='avol' class='inputbg box' onchange="update Neutralisation();"> <option value=25>25.0</option> <option value=10>10.0</option></select></td><td>cm3</td></tr> <tr><td>Vol of strong base req for complete neutralisation</td><td><input type='input'class='box' size="10" id='bvol' value="25.00" disabled /></td><td>cm3</td></tr> <tr><td>Choice of indicator</td><td colspan=2><select id='indtype' class='inputbg box' onchange='change Chart Color(this.value)'> <option value='0'>no indicator</option> <option value='1'>methyl orange</option> <option value='2'>screened methyl orange</option> <option value='3'>phenolphthalein</option> <option value='4'>thymolphthalein</option></select <html> <style type='text/css'> p {font-family: "Lucida Sans Unicode", "Lucida Grande", sans-serif; margin-top: 20px; margin-left:20px;} #main Table { width: 100%; font-family: "Lucida Sans Unicode", "Lucida Grande", sans-serif} #main Table td { vertical-align:top; font-size: 10pt; } .button { font-family: "Lucida Sans Unicode", "Lucida Grande", sans-serif; font-size: 120%; padding: 10px; width: 100% } .box { font-family: "Lucida Sans Unicode", "Lucida Grande", sans-serif; font-size: 100%; padding: 2px; } #titable th { padding: 5px; margin: 5px;} #titable td { text-align : center } .greenbg { background-color:66FF66 } .redbg { background-color:pink } .inputbg { background-color:FFFF00 } .titlebg { background-color:ccddff; font-weight: bold; line-height: 200%; text-align : center; padding: 5px; margin: 5px; width: 500px} #fx stop:nth-child(1){ stop-color: white; } #fx stop:nth-child(2){ stop-color: white; } #fx stop:nth-child(3){ stop-color: white; } ul {list-style-type: none;margin: 0;padding: 0;overflow: hidden;background-color: ccddff;} li {font-family: "Lucida Sans Unicode", "Lucida Grande", sans-serif; font-size: 80%; float: left;} li a, .dropbtn { display: inline-block; color: black; font-weight: bold; text-align: center; padding: 14px 16px; text-decoration: none; } li a:hover, .dropdown:hover .dropbtn {background-color: 99b3ff;} .hover_img a { position:relative;} .hover_img a span { position:absolute; display:none; z-index:99; background-color: ffffff; left:50%; -webkit-transform: translate X(-50%); -ms-transform: translate X(-50%); transform: translate X(-50%);} .hover_img a:hover span { display:block; } </style> <link rel="stylesheet" href="https://code.jquery.com/ui/1.11.4/themes/smoothness/jquery-ui.css"> <script src="https://ajax.googleapis.com/ajax/libs/jquery/2.2.2/jquery.min.js"></script> <script src="https://code.jquery.com/ui/1.11.4/jquery-ui.js"></script> <script src="https://rawgit.com/jmosbech/Sticky Table Headers/master/js/jquery.stickytableheaders.min.js"></script> <script type="text/javascript" src="https://www.gstatic.com/charts/loader.js"></script> <script type="text/javascript"> google.charts.load('current', {'packages':['corechart']}); // Load the Visualization API and the corechart package. google.charts.set On Load Callback(first Load); // Set a callback to run when the Google Visualization API is loaded. var burette Vol = 0; var init Mol = -1; var tot Vol = 0; function create SVG(n,a,b){ var xmlns = "http://www.w3.org/2000/svg"; var e = document.create Element NS (xmlns, n); for(var k in a){ e.set Attribute NS (null, k,a[k]); } for(var k in b){ e.set Attribute (k,b[k]); } return e; }; function first Load() { $(document).ready( function() { $("#titable tbody").html( $("#titable tbody").html() + "<tr><td>" + burette Vol.to Fixed(2) + "</td><td>" + calculate PH().to Fixed(2) + "</td><td>" + tot Vol.to Fixed(2) + "</td></tr>"); update Neutralisation(); $('#titable').sticky Table Headers({ scrollable Area: $('#titable').parent() , fixed Offset:-30 }); $( "#acid Slider" ).slider({ value:100, min: 5, max: 200, step: 5, slide: function( event, ui ) { set Float("aconc", ui.value / 100); }, stop: function( event, ui ) { update Neutralisation(); } }); $( "#base Slider" ).slider({ value:100, min: 5, max: 200, step: 5, slide: function( event, ui ) { set Float("bconc", ui.value / 100); }, stop: function( event, ui ) { update Neutralisation(); } }); $( "#stop TSlider" ).slider({ value:500, min: 10, max: 500, step: 10, slide: function( event, ui ) { set Float("stopt", ui.value / 10); } }); page Loaded = true; }); } function draw Chart() { // Create the data table. var data = new google.visualization.Data Table(); data.add Column('number', 'Volume'); data.add Column('number', 'p H'); var rows = $("#titable tbody tr"); for (i = 0; i < rows.length; i++) data.add Row([ parse Float($( rows[i] ).children()[0].inner HTML), parse Float( $( rows[i] ).children()[1].inner HTML ) ]); // Set chart options var options = { h Axis: { title: 'Volume of weak base added / cm3', title Text Style: {color: '#FF0000', bold: 1, italic: 0, font Size: 20, font Name: 'Lucida Sans Unicode' }, view Window: { min: 0, max: 50 }, ticks: [0, 5, 10, 15, 20, 25, 30, 35, 40, 45, 50]}, v Axis: { title: 'p H', title Text Style: {color: '#FF0000', bold: 1, italic: 0, font Size: 20, font Name: 'Lucida Sans Unicode' }, view Window: { min: 0, max: 14 }, ticks: [0,1,2,3,4,5,6,7,8,9,10,11,12,13,14] }, 'chart Area': { top: 20 }, 'legend': {position: 'none'}, 'width':700, 'height':450, line Width: 3, colors: ['black'] }; // Instantiate and draw our chart, passing in some options. var chart = new google.visualization.Line Chart(document.get Element By Id('chart_div')); google.visualization.events.add Listener(chart, 'ready', function() { var gradient = create SVG('linear Gradient', {x1:0,y1:0, x2:0, y1:1}, {id:'fx'}); document.get Element By Id("chart_div").query Selector('svg>defs').append Child(gradient); gradient.append Child(create SVG('stop',{offset:'0%'})); gradient.append Child(create SVG('stop',{offset:'25%'})); gradient.append Child(create SVG('stop',{offset:'50%'})); gradient.append Child(create SVG('stop',{offset:'100%'})); $("svg").find("[clip-path]").parent().find("rect").first().attr("fill", "url(#fx)").attr("fill-opacity", "1"); change Chart Color($("#indtype").val()); }); function select Handler() { var selected Item = chart.get Selection()[0]; if (selected Item) { var p X = data.get Value(selected Item.row, 0).to Fixed(2); var p Y = data.get Value(selected Item.row, 1).to Fixed(2); $("#p X").val(p X); $("#p Y").val(p Y); } } google.visualization.events.add Listener(chart, 'select', select Handler); chart.draw(data, options) } function get Float(id) { return parse Float( $("#"+id).val() ); } function set Float(id, v) { $("#"+id).val( parse Float(v).to Fixed(2) ) ; } function calculatep Kb() { var x = (-Math.log10(get Float("Kb"))).to Fixed(2); $("#p Kb").val(x); if(get Float("p Kb")<2 || get Float("p Kb")>10) {alert("check Kb value, use scientific notation");} } function p HWB() { return 14 + Math.log10(Math.sqrt( get Float("Kb") * get Float("bconc") )); } function p HBB(conc B, conc S) { return 14 - (-Math.log10(get Float("Kb")) + (Math.log10(conc S/conc B))); } function p HWA(conc) { return -Math.log10(Math.sqrt(1e-14/get Float("Kb")*conc)); } function p HSA(conc) { return -Math.log10(conc) } function calculate PH() { if ( burette Vol.to Fixed(2) == 0 ) { return p HSA(get Float("aconc") * get Float("atype")); } else if (burette Vol.to Fixed(2) == get Float("bvol").to Fixed(2) ) { return p HWA(init Mol/tot Vol); } else if (burette Vol < get Float("bvol") ) { return p HSA( (init Mol - burette Vol * get Float("bconc")) / (tot Vol) ); } else if (burette Vol > get Float("bvol") ) { return p HBB( ( burette Vol * get Float("bconc") - init Mol ), (init Mol) ); } } function init Vars() { init Mol = get Float("aconc") * get Float("avol") * get Float("atype"); tot Vol = get Float("avol"); burette Vol = 0; } function titrate Step() { if (init Mol == -1) init Vars(); burette Vol += get Float("inc"); tot Vol += get Float("inc"); $("#titable tbody").html( $("#titable tbody").html() + "<tr><td>" + burette Vol.to Fixed(2) + "</td><td>" + calculate PH().to Fixed(2) + "</td><td>" + tot Vol.to Fixed(2) + "</td></tr>"); $("#titable").parent().scroll Top( $("#titable").height() ) } function update Neutralisation() { $("#bvol").val( ( ( get Float("avol") * get Float("aconc") * get Float("atype") ) / ( get Float("bconc") ) ).to Fixed(2) ); if (get Float("bvol") > 50) {alert("Titre volume cannot exceed maximum capacity of burette!");} else if (get Float("bvol") < 15) {alert("Titre volume too small, leads to large percentage error!");} reset Titrate(); } function auto Titrate() { while ( burette Vol < get Float("stopt")) { titrate Step(); } } function reset Titrate() { $("#titable tbody").html( "" ) draw Chart(); init Vars(); $("#titable tbody").html( $("#titable tbody").html() + "<tr><td>" + burette Vol.to Fixed(2) + "</td><td>" + calculate PH().to Fixed(2) + "</td><td>" + tot Vol.to Fixed(2) + "</td></tr>"); } var chart Col = {'0': ["white", "white", "white", "white"], '1': ["red", "orange", "#ffff33", "#ffff33"], '2': ["#990099", "grey", "#009933", "#009933"], '3': ["white", "white", "white","fuchsia"], '4': ["white", "white", "white","#2c5ba5"], }; function change Chart Color(ind Type) { $("#fx stop:nth-child(1)").css("stop-color",chart Col[ind Type][0]) $("#fx stop:nth-child(2)").css("stop-color",chart Col[ind Type][1]) $("#fx stop:nth-child(3)").css("stop-color",chart Col[ind Type][2]) $("#fx stop:nth-child(4)").css("stop-color",chart Col[ind Type][3]) } function check Boxes() { if (get Float("p X") == 0 && $("#WB").prop('checked')==false && $("#AS").prop('checked')==false && $("#SA").prop('checked')==true) {alert("Good job!");} else if (get Float("p X") < get Float("bvol") && get Float("p X") > 0 && $("#WB").prop('checked')==false && $("#AS").prop('checked')==true && $("#SA").prop('checked')==true) {alert("Good job!");} else if (get Float("p X") > get Float("bvol") && $("#WB").prop('checked')==true && $("#AS").prop('checked')==true && $("#SA").prop('checked')==false) {alert("Good job!");} else if (get Float("p X") == get Float("bvol") && $("#WB").prop('checked')==false && $("#AS").prop('checked')==true && $("#SA").prop('checked')==false) {alert("Good job!");} else {alert("Please try again.");} } function check Buffer() { if ( (14-get Float("p Y")) > (get Float("p Kb")-1) && (14-get Float("p Y")) < (get Float("p Kb")+1) ) { if($("#buffer").prop('checked')==true) {alert("Good job!");} else {alert("Please try again. What are the 2 components required in large excess to form a buffer?");} } else if ( (14-get Float("p Y")) < (get Float("p Kb")-1) || (14-get Float("p Y")) > (get Float("p Kb")+1) ) { if($("#buffer").prop('checked')==false) {alert("Good job!");} else {alert("Please try again. What are the 2 components required in large excess to form a buffer?");} } } </script> <body> <ul> <li><a class="active" a href="index.html">Introduction</a></li> <li><a href="SASB.html">Strong Acid - Strong Base</a></li> <li><a href="SBSA.html">Strong Base - Strong Acid</a></li> <li><a href="WASB.html">Weak Acid - Strong Base</a></li> <li><a href="WBSA.html">Weak Base - Strong Acid</a></li> <li><a href="SBWA.html">Strong Base - Weak Acid</a></li> <li><a href="SAWB.html">Strong Acid - Weak Base</a></li> </ul> <div class="hover_img"> <p style="font-size:20px"><b>Titration Curve of Strong Acid against Weak Base</b> <a href="#">(image)<span><img src="SAWB.png" height=500 border=2 ></span></a></p> </div> <table id='main Table' border=0 cellspacing=5 cellpadding=5> <tr><td><table cellpadding=5 width="20%"> <tr><td colspan=3 class='titlebg'>Set Titration Parameters</td></tr> <tr><td>[acid] = </td><td><input type='input' onchange='update Neutralisation()' class='inputbg box'size="10" id='aconc' value="1.00"/><br /><div id="acid Slider"></td><td>mol dm-3</td></tr> <tr><td>Strong acid is</td><td colspan=2><select id='atype' class='inputbg box' onchange='update Neutralisation()'> <option value=1>monoprotic</option> <option value=2>diprotic</option></select></td></tr> <tr><td width="10%">[base] = </td><td><input type='input' onchange='update Neutralisation()' class='inputbg box' size="10" id='bconc' value="1.00" /><br /><div id="base Slider"></td><td>mol dm-3</td></tr> <tr><td>Kb (scientific notation) = </td><td><input type='input'class='inputbg box' size="10" id='Kb' value="1.80e-5" onchange='calculatep Kb(); update Neutralisation()' /></td><td>mol dm-3</td></tr> <tr><td>p Kb = </td><td><input type='input' class='box'size="10" id='p Kb' value="4.74" disabled /></td></tr> <tr><td>Vol of strong acid in conical flask</td><td><select id='avol' class='inputbg box' onchange="update Neutralisation();"> <option value=25>25.0</option> <option value=10>10.0</option></select></td><td>cm3</td></tr> <tr><td>Vol of weak base req for complete neutralisation</td><td><input type='input'class='box' size="10" id='bvol' value="25.00" disabled /></td><td>cm3</td></tr> <tr><td>Choice of indicator</td><td colspan=2><select id='indtype' class='inputbg box' onchange='change Chart Color(this.value)'> <option value='0'>no indicator</option> <option value='1'>methyl orange</option> <option value='2'>screened methyl orange</option> <option value='3'>phenolphthalein</option> <option value='4'>thymolphthalein</option></select></td></tr> <tr><td>Data points in increments of</td><td><select id='inc' class='inputbg box' value="1.00"> <option value=1.00>1.00</option> <option value=0.50>0.50</option> <option value=0.05>0.05 (1 drop)</option></select></td><td>cm3</td></tr> <tr><td colspan=3></td></tr> <tr><td>Stop titration at (for auto titration only)</td><td><input type='input' onchange='update Neutralisation()' class='inputbg box' size="10" id='stopt' value="50.00" /><br /><div id="stop TSlider"></td><td>cm3</td></tr> <tr><td colspan=3></td></tr> <tr> <td><input type='button' class='button greenbg' value="Do Titration Stepwise" onclick='titrate Step(); draw Chart()'></input></td> <td><input type='button' class='button redbg' value="Auto Titration" onclick='auto Titrate(); draw Chart()'></input></td> <td><input type='button' class='button' value="Reset" onclick='reset Titrate();'></input></td> </tr> </table></td> <td align=center><div id="chart_div"></div> <p class='titlebg'>Selected Point</p> Burette Volume <input type='input' class='box' size="6" id='p X' value="0.00" disabled /> p H <input type='input' class='box' size="6" id='p Y' value="0.00" disabled /><br> Select the major species present in the conical flask<br> <input type="checkbox" id="SA" value="0"> SA <input type="checkbox" id="AS" value="0"> conj acid of WB <input type="checkbox" id="WB" value="0"> xs WB <input type="submit" value="Check" onclick='check Boxes()'><br> Is solution a buffer? <input type="checkbox" id="buffer" value="0"> yes <input type="submit" value="Check" onclick='check Buffer()'> </b> </td> <td> <div style='overflow:scroll; width: 200px; height:550px'> <table id="titable"> <thead><th>Burette Vol</th><th>p H</th><th>Total Vol</th></thead> <html> <style type='text/css'> p {font-family: "Lucida Sans Unicode", "Lucida Grande", sans-serif; margin-top: 20px; margin-left:20px;} #main Table { width: 100%; font-family: "Lucida Sans Unicode", "Lucida Grande", sans-serif} #main Table td { vertical-align:top; font-size: 10pt; } .button { font-family: "Lucida Sans Unicode", "Lucida Grande", sans-serif; font-size: 120%; padding: 10px; width: 100% } .box { font-family: "Lucida Sans Unicode", "Lucida Grande", sans-serif; font-size: 100%; padding: 2px; } #titable th { padding: 5px; margin: 5px;} #titable td { text-align : center } .greenbg { background-color:66FF66 } .redbg { background-color:pink } .inputbg { background-color:FFFF00 } .titlebg { background-color:ccddff; font-weight: bold; line-height: 200%; text-align : center; padding: 5px; margin: 5px; width: 500px} #fx stop:nth-child(1){ stop-color: white; } #fx stop:nth-child(2){ stop-color: white; } #fx stop:nth-child(3){ stop-color: white; } ul {list-style-type: none;margin: 0;padding: 0;overflow: hidden;background-color: ccddff;} li {font-family: "Lucida Sans Unicode", "Lucida Grande", sans-serif; font-size: 80%; float: left;} li a, .dropbtn { display: inline-block; color: black; font-weight: bold; text-align: center; padding: 14px 16px; text-decoration: none; } li a:hover, .dropdown:hover .dropbtn {background-color: 99b3ff;} .hover_img a { position:relative;} .hover_img a span { position:absolute; display:none; z-index:99; background-color: ffffff; left:50%; -webkit-transform: translate X(-50%); -ms-transform: translate X(-50%); transform: translate X(-50%);} .hover_img a:hover span { display:block; } </style> <link rel="stylesheet" href="https://code.jquery.com/ui/1.11.4/themes/smoothness/jquery-ui.css"> <script src="https://ajax.googleapis.com/ajax/libs/jquery/2.2.2/jquery.min.js"></script> <script src="https://code.jquery.com/ui/1.11.4/jquery-ui.js"></script> <script src="https://rawgit.com/jmosbech/Sticky Table Headers/master/js/jquery.stickytableheaders.min.js"></script> <script type="text/javascript" src="https://www.gstatic.com/charts/loader.js"></script> <script type="text/javascript"> google.charts.load('current', {'packages':['corechart']}); // Load the Visualization API and the corechart package. google.charts.set On Load Callback(first Load); // Set a callback to run when the Google Visualization API is loaded. var burette Vol = 0; var init Mol = -1; var tot Vol = 0; function create SVG(n,a,b){ var xmlns = "http://www.w3.org/2000/svg"; var e = document.create Element NS (xmlns, n); for(var k in a){ e.set Attribute NS (null, k,a[k]); } for(var k in b){ e.set Attribute (k,b[k]); } return e; }; function first Load() { $(document).ready( function() { $("#titable tbody").html( $("#titable tbody").html() + "<tr><td>" + burette Vol.to Fixed(2) + "</td><td>" + calculate PH().to Fixed(2) + "</td><td>" + tot Vol.to Fixed(2) + "</td></tr>"); update Neutralisation(); $('#titable').sticky Table Headers({ scrollable Area: $('#titable').parent() , fixed Offset:-30 }); $( "#acid Slider" ).slider({ value:100, min: 5, max: 200, step: 5, slide: function( event, ui ) { set Float("aconc", ui.value / 100); }, stop: function( event, ui ) { update Neutralisation(); } }); $( "#base Slider" ).slider({ value:100, min: 5, max: 200, step: 5, slide: function( event, ui ) { set Float("bconc", ui.value / 100); }, stop: function( event, ui ) { update Neutralisation(); } }); $( "#stop TSlider" ).slider({ value:500, min: 10, max: 500, step: 10, slide: function( event, ui ) { set Float("stopt", ui.value / 10); } }); page Loaded = true; }); } function draw Chart() { // Create the data table. var data = new google.visualization.Data Table(); data.add Column('number', 'Volume'); data.add Column('number', 'p H'); var rows = $("#titable tbody tr"); for (i = 0; i < rows.length; i++) data.add Row([ parse Float($( rows[i] ).children()[0].inner HTML), parse Float( $( rows[i] ).children()[1].inner HTML ) ]); // Set chart options var options = { h Axis: { title: 'Volume of strong acid added / cm3', title Text Style: {color: '#FF0000', bold: 1, italic: 0, font Size: 20, font Name: 'Lucida Sans Unicode' }, view Window: { min: 0, max: 50 }, ticks: [0, 5, 10, 15, 20, 25, 30, 35, 40, 45, 50]}, v Axis: { title: 'p H', title Text Style: {color: '#FF0000', bold: 1, italic: 0, font Size: 20, font Name: 'Lucida Sans Unicode' }, view Window: { min: 0, max: 14 }, ticks: [0,1,2,3,4,5,6,7,8,9,10,11,12,13,14] }, 'chart Area': { top: 20 }, 'legend': {position: 'none'}, 'width':700, 'height':450, line Width: 3, colors: ['black'] }; // Instantiate and draw our chart, passing in some options. var chart = new google.visualization.Line Chart(document.get Element By Id('chart_div')); google.visualization.events.add Listener(chart, 'ready', function() { var gradient = create SVG('linear Gradient', {x1:0,y1:0, x2:0, y1:1}, {id:'fx'}); document.get Element By Id("chart_div").query Selector('svg>defs').append Child(gradient); gradient.append Child(create SVG('stop',{offset:'0%'})); gradient.append Child(create SVG('stop',{offset:'25%'})); gradient.append Child(create SVG('stop',{offset:'50%'})); gradient.append Child(create SVG('stop',{offset:'100%'})); $("svg").find("[clip-path]").parent().find("rect").first().attr("fill", "url(#fx)").attr("fill-opacity", "1"); change Chart Color($("#indtype").val()); }); function select Handler() { var selected Item = chart.get Selection()[0]; if (selected Item) { set Float( "p X", data.get Value(selected Item.row, 0) ); set Float( "p Y", data.get Value(selected Item.row, 1) ); } } google.visualization.events.add Listener(chart, 'select', select Handler); chart.draw(data, options) } function get Float(id) { return parse Float( $("#"+id).val() ); } function set Float(id, v) { $("#"+id).val( parse Float(v).to Fixed(2) ) ; } function p HSA(conc) { return -Math.log10(conc); } function p HSB(conc) { return 14 + Math.log10(conc) } function calculate PH() { if (burette Vol.to Fixed(2) == get Float("avol").to Fixed(2) ){ return 7.0; } else if (burette Vol < get Float("avol") ) { return p HSB( ( init Mol - burette Vol * get Float("aconc") * get Float("atype") ) / (tot Vol) ); } else if (burette Vol > get Float("avol") ) { return p HSA(( ( burette Vol * get Float("aconc") * get Float("atype") ) - init Mol ) / (tot Vol) ); } } function init Vars() { init Mol = get Float("bconc") * get Float("bvol") * get Float("btype"); tot Vol = get Float("bvol"); burette Vol = 0; } function titrate Step() { if (init Mol == -1) init Vars(); burette Vol += get Float("inc"); tot Vol += get Float("inc"); $("#titable tbody").html( $("#titable tbody").html() + "<tr><td>" + burette Vol.to Fixed(2) + "</td><td>" + calculate PH().to Fixed(2) + "</td><td>" + tot Vol.to Fixed(2) + "</td></tr>"); $("#titable").parent().scroll Top( $("#titable").height() ) } function update Neutralisation() { set Float("avol", get Float("bvol") * get Float("btype") * get Float("bconc") / (get Float("atype") * get Float("aconc")) ); if (get Float("avol") > 50) {alert("Titre volume cannot exceed maximum capacity of burette!");} else if (get Float("avol") < 15) {alert("Titre volume too small, leads to large percentage error!");} reset Titrate(); } function auto Titrate() { while ( burette Vol < get Float("stopt")) { titrate Step(); } } function reset Titrate() { $("#titable tbody").html( "" ) draw Chart(); init Vars(); $("#titable tbody").html( $("#titable tbody").html() + "<tr><td>" + burette Vol.to Fixed(2) + "</td><td>" + calculate PH().to Fixed(2) + "</td><td>" + tot Vol.to Fixed(2) + "</td></tr>"); } var chart Col = {'0': ["white", "white", "white", "white"], '1': ["red", "orange", "#ffff33", "#ffff33"], '2': ["#990099", "grey", "#009933", "#009933"], '3': ["white", "white", "white","fuchsia"], '4': ["white", "white", "white","#2c5ba5"], }; function change Chart Color(ind Type) { $("#fx stop:nth-child(1)").css("stop-color",chart Col[ind Type][0]) $("#fx stop:nth-child(2)").css("stop-color",chart Col[ind Type][1]) $("#fx stop:nth-child(3)").css("stop-color",chart Col[ind Type][2]) $("#fx stop:nth-child(4)").css("stop-color",chart Col[ind Type][3]) } function check Boxes() { if (get Float("p X") < get Float("avol") && get Float("p X") > 0 && $("#SB").prop('checked')==true && $("#NS").prop('checked')==true && $("#SA").prop('checked')==false) {alert("Good job!");} else if (get Float("p X") > get Float("avol") && $("#SB").prop('checked')==false && $("#NS").prop('checked')==true && $("#SA").prop('checked')==true) {alert("Good job!");} else if (get Float("p X") == get Float("avol") && $("#SB").prop('checked')==false && $("#NS").prop('checked')==true && $("#SA").prop('checked')==false) {alert("Good job!");} else if (get Float("p X") == 0 && $("#SB").prop('checked')==true && $("#NS").prop('checked')==false && $("#SA").prop('checked')==false) {alert("Good job!");} else {alert("Please try again.");} } </script> <body> <ul> <li><a class="active" a href="index.html">Introduction</a></li> <li><a href="SASB.html">Strong Acid - Strong Base</a></li> <li><a href="SBSA.html">Strong Base - Strong Acid</a></li> <li><a href="WASB.html">Weak Acid - Strong Base</a></li> <li><a href="WBSA.html">Weak Base - Strong Acid</a></li> <li><a href="SBWA.html">Strong Base - Weak Acid</a></li> <li><a href="SAWB.html">Strong Acid - Weak Base</a></li> </ul> <div class="hover_img"> <p style="font-size:20px"><b>Titration Curve of Strong Base against Strong Acid</b> <a href="#">(image)<span><img src="SBSA.png" height=500 border=2 ></span></a></p> </div> <table id='main Table' border=0 cellspacing=5 cellpadding=5> <tr><td><table cellpadding=5 width="20%"> <tr><td colspan=3 class='titlebg'>Set Titration Parameters</td></tr> <tr><td>[base] = </td><td><input type='input' onchange='update Neutralisation()' class='inputbg box'size="10" id='bconc' value="1.00"/><br /><div id="base Slider"></td><td>mol dm-3</td></tr> <tr><td>Strong base is</td><td colspan=2><select id='btype' class='inputbg box' onchange='update Neutralisation()'> <option value=1>monoprotic</option> <option value=2>diprotic</option></select></td></tr> <tr><td width="10%">[acid] = </td><td><input type='input' onchange='update Neutralisation()' class='inputbg box' size="10" id='aconc' value="1.00" /><br /><div id="acid Slider"></td><td>mol dm-3</td></tr> <tr><td>Strong acid is</td><td colspan=2><select id='atype' class='inputbg box' onchange='update Neutralisation()'> <option value=1>monoprotic</option> <option value=2>diprotic</option></select></td></tr> <tr><td>Vol of strong base in conical flask</td><td><select id='bvol' class='inputbg box' onchange="update Neutralisation();"> <option value=25>25.0</option> <option value=10>10.0</option></select></td><td>cm3</td></tr> <tr><td>Vol of strong acid req for complete neutralisation</td><td><input type='input'class='box' size="10" id='avol' value="25.00" disabled /></td><td>cm3</td></tr> <tr><td>Choice of indicator</td><td colspan=2><select id='indtype' class='inputbg box' onchange='change Chart Color(this.value)'> <option value='0'>no indicator</option> <option value='1'>methyl orange</option> <option value='2'>screened methyl orange</option> <option value='3'>phenolphthalein</option> <option value='4'>thymolphthalein</option></select></td></tr> <tr><td>Data points in increments of</td><td><select id='inc' class='inputbg box' value="1.00"> <option value=1.00>1.00</option> <option value=0.50>0.50</option> <option value=0.05>0.05 (1 drop)</option></select></td><td>cm3</td></tr> <tr><td colspan=3></td></tr> <tr><td>Stop titration at (for auto titration only)</td><td><input type='input' onchange='update Neutralisation()' class='inputbg box' size="10" id='stopt' value="50.00" /><br /><div id="stop TSlider"></td><td>cm3</td></tr> <tr><td colspan=3></td></tr> <tr> <td><input type='button' class='button greenbg' value="Do Titration Stepwise" onclick='titrate Step(); draw Chart()'></input></td> <td><input type='button' class='button redbg' value="Auto Titration" onclick='auto Titrate(); draw Chart()'></input></td> <td><input type='button' class='button' value="Reset" onclick='reset Titrate();'></input></td> </tr> </table></td> <td align=center><div id="chart_div"></div> <p class='titlebg'>Selected Point</p> Burette Volume <input type='input' class='box' size="6" id='p X' value="0.00" disabled /> p H <input type='input' class='box' size="6" id='p Y' value="0.00" disabled /><br> Select all the species present in the conical flask<br> <input type="checkbox" id="SB" value="0"> strong base <input type="checkbox" id="NS" value="0"> neutral salt <input type="checkbox" id="SA" value="0"> strong acid <input type="submit" value="Check" onclick='check Boxes()'> </b> </td> <td> <div style='overflow:scroll; width: 200px; height:550px'> <table id="titable"> <thead><th>Burette Vol</th><th>p H</th><th>Total Vol</th></thead> <tbody></tbody> </table> </div> </td> </tr> </table> </body> </html> <html> <style type='text/css'> p {font-family: "Lucida Sans Unicode", "Lucida Grande", sans-serif; margin-top: 20px; margin-left:20px;} #main Table { width: 100%; font-family: "Lucida Sans Unicode", "Lucida Grande", sans-serif} #main Table td { vertical-align:top; font-size: 10pt; } .button { font-family: "Lucida Sans Unicode", "Lucida Grande", sans-serif; font-size: 120%; padding: 10px; width: 100% } .box { font-family: "Lucida Sans Unicode", "Lucida Grande", sans-serif; font-size: 100%; padding: 2px; } #titable th { padding: 5px; margin: 5px;} #titable td { text-align : center } .greenbg { background-color:66FF66 } .redbg { background-color:pink } .inputbg { background-color:FFFF00 } .titlebg { background-color:ccddff; font-weight: bold; line-height: 200%; text-align : center; padding: 5px; margin: 5px; width: 500px} #fx stop:nth-child(1){ stop-color: white; } #fx stop:nth-child(2){ stop-color: white; } #fx stop:nth-child(3){ stop-color: white; } ul {list-style-type: none;margin: 0;padding: 0;overflow: hidden;background-color: ccddff;} li {font-family: "Lucida Sans Unicode", "Lucida Grande", sans-serif; font-size: 80%; float: left;} li a, .dropbtn { display: inline-block; color: black; font-weight: bold; text-align: center; padding: 14px 16px; text-decoration: none; } li a:hover, .dropdown:hover .dropbtn {background-color: 99b3ff;} .hover_img a { position:relative;} .hover_img a span { position:absolute; display:none; z-index:99; background-color: ffffff; left:50%; -webkit-transform: translate X(-50%); -ms-transform: translate X(-50%); transform: translate X(-50%);} .hover_img a:hover span { display:block; } </style> <link rel="stylesheet" href="https://code.jquery.com/ui/1.11.4/themes/smoothness/jquery-ui.css"> <script src="https://ajax.googleapis.com/ajax/libs/jquery/2.2.2/jquery.min.js"></script> <script src="https://code.jquery.com/ui/1.11.4/jquery-ui.js"></script> <script src="https://rawgit.com/jmosbech/Sticky Table Headers/master/js/jquery.stickytableheaders.min.js"></script> <script type="text/javascript" src="https://www.gstatic.com/charts/loader.js"></script> <script type="text/javascript"> google.charts.load('current', {'packages':['corechart']}); // Load the Visualization API and the corechart package. google.charts.set On Load Callback(first Load); // Set a callback to run when the Google Visualization API is loaded. var burette Vol = 0; var init Mol = -1; var tot Vol = 0; function create SVG(n,a,b){ var xmlns = "http://www.w3.org/2000/svg"; var e = document.create Element NS (xmlns, n); for(var k in a){ e.set Attribute NS (null, k,a[k]); } for(var k in b){ e.set Attribute (k,b[k]); } return e; }; function first Load() { $(document).ready( function() { $("#titable tbody").html( $("#titable tbody").html() + "<tr><td>" + burette Vol.to Fixed(2) + "</td><td>" + calculate PH().to Fixed(2) + "</td><td>" + tot Vol.to Fixed(2) + "</td></tr>"); update Neutralisation(); $('#titable').sticky Table Headers({ scrollable Area: $('#titable').parent() , fixed Offset:-30 }); $( "#acid Slider" ).slider({ value:100, min: 5, max: 200, step: 5, slide: function( event, ui ) { set Float("aconc", ui.value / 100); }, stop: function( event, ui ) { update Neutralisation(); } }); $( "#base Slider" ).slider({ value:100, min: 5, max: 200, step: 5, slide: function( event, ui ) { set Float("bconc", ui.value / 100); }, stop: function( event, ui ) { update Neutralisation(); } }); $( "#stop TSlider" ).slider({ value:500, min: 10, max: 500, step: 10, slide: function( event, ui ) { set Float("stopt", ui.value / 10); } }); page Loaded = true; }); } function draw Chart() { // Create the data table. var data = new google.visualization.Data Table(); data.add Column('number', 'Volume'); data.add Column('number', 'p H'); var rows = $("#titable tbody tr"); for (i = 0; i < rows.length; i++) data.add Row([ parse Float($( rows[i] ).children()[0].inner HTML), parse Float( $( rows[i] ).children()[1].inner HTML ) ]); // Set chart options var options = { h Axis: { title: 'Volume of weak acid added / cm3', title Text Style: {color: '#FF0000', bold: 1, italic: 0, font Size: 20, font Name: 'Lucida Sans Unicode' }, view Window: { min: 0, max: 50 }, ticks: [0, 5, 10, 15, 20, 25, 30, 35, 40, 45, 50]}, v Axis: { title: 'p H', title Text Style: {color: '#FF0000', bold: 1, italic: 0, font Size: 20, font Name: 'Lucida Sans Unicode' }, view Window: { min: 0, max: 14 }, ticks: [0,1,2,3,4,5,6,7,8,9,10,11,12,13,14] }, 'chart Area': { top: 20 }, 'legend': {position: 'none'}, 'width':700, 'height':450, line Width: 3, colors: ['black'] }; // Instantiate and draw our chart, passing in some options. var chart = new google.visualization.Line Chart(document.get Element By Id('chart_div')); google.visualization.events.add Listener(chart, 'ready', function() { var gradient = create SVG('linear Gradient', {x1:0,y1:0, x2:0, y1:1}, {id:'fx'}); document.get Element By Id("chart_div").query Selector('svg>defs').append Child(gradient); gradient.append Child(create SVG('stop',{offset:'0%'})); gradient.append Child(create SVG('stop',{offset:'25%'})); gradient.append Child(create SVG('stop',{offset:'50%'})); gradient.append Child(create SVG('stop',{offset:'100%'})); $("svg").find("[clip-path]").parent().find("rect").first().attr("fill", "url(#fx)").attr("fill-opacity", "1"); change Chart Color($("#indtype").val()); }); function select Handler() { var selected Item = chart.get Selection()[0]; if (selected Item) { var p X = data.get Value(selected Item.row, 0).to Fixed(2); var p Y = data.get Value(selected Item.row, 1).to Fixed(2); $("#p X").val(p X); $("#p Y").val(p Y); } } google.visualization.events.add Listener(chart, 'select', select Handler); chart.draw(data, options) } function get Float(id) { return parse Float( $("#"+id).val() ); } function set Float(id, v) { $("#"+id).val( parse Float(v).to Fixed(2) ) ; } function calculatep Ka() { var x = (- Math.log10(get Float("Ka"))).to Fixed(2); $("#p Ka").val(x); if(get Float("p Ka")<2 || get Float("p Ka")>10) {alert("check Ka value, use scientific notation");} } function p HWA() { return -Math.log10(Math.sqrt( get Float("Ka") * get Float("aconc") )); } function p HAB(conc A, conc S) { return -Math.log10(get Float("Ka")) + (Math.log10(conc S/conc A)); } //not tested function p HWB(conc) { return 14+Math.log10(Math.sqrt(1e-14/get Float("Ka")*conc)); } function p HSB(conc) { return 14 + Math.log10(conc) } function calculate PH() { if ( burette Vol.to Fixed(2) == 0 ) { return p HSB(get Float("bconc") * get Float("btype")); } else if (burette Vol.to Fixed(2) == get Float("avol").to Fixed(2) ) { return p HWB(init Mol/tot Vol); } else if (burette Vol < get Float("avol") ) { return p HSB( (init Mol - burette Vol * get Float("aconc") ) / tot Vol ); } else if (burette Vol > get Float("avol") ) { return p HAB( ( burette Vol * get Float("aconc") - init Mol ) , init Mol ); } } function init Vars() { init Mol = get Float("bconc") * get Float("bvol") * get Float("btype"); tot Vol = get Float("bvol"); burette Vol = 0; } function titrate Step() { if (init Mol == -1) init Vars(); burette Vol += get Float("inc"); tot Vol += get Float("inc"); $("#titable tbody").html( $("#titable tbody").html() + "<tr><td>" + burette Vol.to Fixed(2) + "</td><td>" + calculate PH().to Fixed(2) + "</td><td>" + tot Vol.to Fixed(2) + "</td></tr>"); $("#titable").parent().scroll Top( $("#titable").height() ) } function update Neutralisation() { $("#avol").val( ( get Float("bvol") * get Float("bconc") * get Float("btype") / get Float("aconc") ).to Fixed(2) ); if (get Float("avol") > 50) {alert("Titre volume cannot exceed maximum capacity of burette!");} else if (get Float("avol") < 15) {alert("Titre volume too small, leads to large percentage error!");} reset Titrate(); } function auto Titrate() { while ( burette Vol < get Float("stopt")) { titrate Step(); } } function reset Titrate() { $("#titable tbody").html( "" ) draw Chart(); init Vars(); $("#titable tbody").html( $("#titable tbody").html() + "<tr><td>" + burette Vol.to Fixed(2) + "</td><td>" + calculate PH().to Fixed(2) + "</td><td>" + tot Vol.to Fixed(2) + "</td></tr>"); } var chart Col = {'0': ["white", "white", "white", "white"], '1': ["red", "orange", "#ffff33", "#ffff33"], '2': ["#990099", "grey", "#009933", "#009933"], '3': ["white", "white", "white","fuchsia"], '4': ["white", "white", "white","#2c5ba5"], }; function change Chart Color(ind Type) { $("#fx stop:nth-child(1)").css("stop-color",chart Col[ind Type][0]) $("#fx stop:nth-child(2)").css("stop-color",chart Col[ind Type][1]) $("#fx stop:nth-child(3)").css("stop-color",chart Col[ind Type][2]) $("#fx stop:nth-child(4)").css("stop-color",chart Col[ind Type][3]) } function check Boxes() { if (get Float("p X") == 0 && $("#WA").prop('checked')==false && $("#BS").prop('checked')==false && $("#SB").prop('checked')==true) {alert("Good job!");} else if (get Float("p X") < get Float("avol") && get Float("p X") > 0 && $("#WA").prop('checked')==false && $("#BS").prop('checked')==true && $("#SB").prop('checked')==true) {alert("Good job!");} else if (get Float("p X") > get Float("avol") && $("#WA").prop('checked')==true && $("#BS").prop('checked')==true && $("#SB").prop('checked')==false) {alert("Good job!");} else if (get Float("p X") == get Float("avol") && $("#WA").prop('checked')==false && $("#BS").prop('checked')==true && $("#SB").prop('checked')==false) {alert("Good job!");} else {alert("Please try again.");} } function check Buffer() { if ( get Float("p Y") > (get Float("p Ka")-1) && get Float("p Y") < (get Float("p Ka")+1) ) { if($("#buffer").prop('checked')==true) {alert("Good job!");} else {alert("Please try again. What are the 2 components required in large excess to form a buffer?");} } if (get Float("p Y") < (get Float("p Ka")-1) || get Float("p Y") > (get Float("p Ka")+1)) { if($("#buffer").prop('checked')==false) {alert("Good job!");} else {alert("Please try again. What are the 2 components required in large excess to form a buffer?");} } } </script> <body> <ul> <li><a class="active" a href="index.html">Introduction</a></li> <li><a href="SASB.html">Strong Acid - Strong Base</a></li> <li><a href="SBSA.html">Strong Base - Strong Acid</a></li> <li><a href="WASB.html">Weak Acid - Strong Base</a></li> <li><a href="WBSA.html">Weak Base - Strong Acid</a></li> <li><a href="SBWA.html">Strong Base - Weak Acid</a></li> <li><a href="SAWB.html">Strong Acid - Weak Base</a></li> </ul> <div class="hover_img"> <p style="font-size:20px"><b>Titration Curve of Strong Base against Weak Acid</b> <a href="#">(image)<span><img src="SBWA.png" height=500 border=2 ></span></a></p> </div> <table id='main Table' border=0 cellspacing=5 cellpadding=5> <tr><td><table cellpadding=5 width="20%"> <tr><td colspan=3 class='titlebg'>Set Titration Parameters</td></tr> <tr><td>[base] = </td><td><input type='input' onchange='update Neutralisation()' class='inputbg box'size="10" id='bconc' value="1.00"/><br /><div id="base Slider"></td><td>mol dm-3</td></tr> <tr><td>Strong base is</td><td colspan=2><select id='btype' class='inputbg box' onchange='update Neutralisation()'> <option value=1>monoprotic</option> <option value=2>diprotic</option></select></td></tr> <tr><td width="10%">[acid] = </td><td><input type='input' onchange='update Neutralisation()' class='inputbg box' size="10" id='aconc' value="1.00" /><br /><div id="acid Slider"></td><td>mol dm-3</td></tr> <tr><td>Ka (scientific notation) = </td><td><input type='input'class='inputbg box' size="10" id='Ka' value="1.80e-5" onchange='calculatep Ka(); update Neutralisation()' /></td><td>mol dm-3</td></tr> <tr><td>p Ka = </td><td><input type='input' class='box'size="10" id='p Ka' value="4.74" disabled /></td></tr> <tr><td>Vol of strong base in conical flask</td><td><select id='bvol' class='inputbg box' onchange="update Neutralisation();"> <option value=25>25.0</option> <option value=10>10.0</option></select></td><td>cm3</td></tr> <tr><td>Vol of weak acid req for complete neutralisation</td><td><input type='input'class='box' size="10" id='avol' value="25.00" disabled /></td><td>cm3</td></tr> <tr><td>Choice of indicator</td><td colspan=2><select id='indtype' class='inputbg box' onchange='change Chart Color(this.value)'> <option value='0'>no indicator</option> <option value='1'>methyl orange</option> <option value='2'>screened methyl orange</option> <option value='3'>phenolphthalein</option> <option value='4'>thymolphthalein</option></select></td></tr> <tr><td>Data points in increments of</td><td><select id='inc' class='inputbg box' value="1.00"> <option value=1.00>1.00</option> <option value=0.50>0.50</option> <option value=0.05>0.05 (1 drop)</option></select></td><td>cm3</td></tr> <tr><td colspan=3></td></tr> <tr><td>Stop titration at (for auto titration only)</td><td><input type='input' onchange='update Neutralisation()' class='inputbg box' size="10" id='stopt' value="50.00" /><br /><div id="stop TSlider"></td><td>cm3</td></tr> <tr><td colspan=3></td></tr> <tr> <td><input type='button' class='button greenbg' value="Do Titration Stepwise" onclick='titrate Step(); draw Chart()'></input></td> <td><input type='button' class='button redbg' value="Auto Titration" onclick='auto Titrate(); draw Chart()'></input></td> <td><input type='button' class='button' value="Reset" onclick='reset Titrate();'></input></td> </tr> </table></td> <td align=center><div id="chart_div"></div> <p class='titlebg'>Selected Point</p> Burette Volume <input type='input' class='box' size="6" id='p X' value="0.00" disabled /> p H <input type='input' class='box' size="6" id='p Y' value="0.00" disabled /><br> Select the major species present in the conical flask<br> <input type="checkbox" id="SB" value="0"> SB <input type="checkbox" id="BS" value="0"> conj base of WA <input type="checkbox" id="WA" value="0"> xs WA <input type="submit" value="Check" onclick='check Boxes()'><br> Is solution a buffer? <input type="checkbox" id="buffer" value="0"> yes <input type="submit" value="Check" onclick='check Buffer()'> </b> </td> <td> <div style='overflow:scroll; width: 200px; height:550px'> <table id="titable"> <thead><th>Burette Vol</th><th>p H</th><th>Tot Vol</th></thead> <tbody></tbody> </tabl <html> <style type='text/css'> p {font-family: "Lucida Sans Unicode", "Lucida Grande", sans-serif; margin-top: 20px; margin-left:20px;} #main Table { width: 100%; font-family: "Lucida Sans Unicode", "Lucida Grande", sans-serif} #main Table td { vertical-align:top; font-size: 10pt; } .button { font-family: "Lucida Sans Unicode", "Lucida Grande", sans-serif; font-size: 120%; padding: 10px; width: 100% } .box { font-family: "Lucida Sans Unicode", "Lucida Grande", sans-serif; font-size: 100%; padding: 2px; } #titable th { padding: 5px; margin: 5px;} #titable td { text-align : center } .greenbg { background-color:66FF66 } .redbg { background-color:pink } .inputbg { background-color:FFFF00 } .titlebg { background-color:ccddff; font-weight: bold; line-height: 200%; text-align : center; padding: 5px; margin: 5px; width: 500px} #fx stop:nth-child(1){ stop-color: white; } #fx stop:nth-child(2){ stop-color: white; } #fx stop:nth-child(3){ stop-color: white; } ul {list-style-type: none;margin: 0;padding: 0;overflow: hidden;background-color: ccddff;} li {font-family: "Lucida Sans Unicode", "Lucida Grande", sans-serif; font-size: 80%; float: left;} li a, .dropbtn { display: inline-block; color: black; font-weight: bold; text-align: center; padding: 14px 16px; text-decoration: none; } li a:hover, .dropdown:hover .dropbtn {background-color: 99b3ff;} .hover_img a { position:relative;} .hover_img a span { position:absolute; display:none; z-index:99; background-color: ffffff; left:50%; -webkit-transform: translate X(-50%); -ms-transform: translate X(-50%); transform: translate X(-50%);} .hover_img a:hover span { display:block; } </style> <link rel="stylesheet" href="https://code.jquery.com/ui/1.11.4/themes/smoothness/jquery-ui.css"> <script src="https://ajax.googleapis.com/ajax/libs/jquery/2.2.2/jquery.min.js"></script> <script src="https://code.jquery.com/ui/1.11.4/jquery-ui.js"></script> <script src="https://rawgit.com/jmosbech/Sticky Table Headers/master/js/jquery.stickytableheaders.min.js"></script> <script type="text/javascript" src="https://www.gstatic.com/charts/loader.js"></script> <script type="text/javascript"> google.charts.load('current', {'packages':['corechart']}); // Load the Visualization API and the corechart package. google.charts.set On Load Callback(first Load); // Set a callback to run when the Google Visualization API is loaded. var burette Vol = 0; var init Mol = -1; var tot Vol = 0; function create SVG(n,a,b){ var xmlns = "http://www.w3.org/2000/svg"; var e = document.create Element NS (xmlns, n); for(var k in a){ e.set Attribute NS (null, k,a[k]); } for(var k in b){ e.set Attribute (k,b[k]); } return e; }; function first Load() { $(document).ready( function() { $("#titable tbody").html( $("#titable tbody").html() + "<tr><td>" + burette Vol.to Fixed(2) + "</td><td>" + calculate PH().to Fixed(2) + "</td><td>" + tot Vol.to Fixed(2) + "</td></tr>"); update Neutralisation(); $('#titable').sticky Table Headers({ scrollable Area: $('#titable').parent() , fixed Offset:-30 }); $( "#acid Slider" ).slider({ value:100, min: 5, max: 200, step: 5, slide: function( event, ui ) { set Float("aconc", ui.value / 100); }, stop: function( event, ui ) { update Neutralisation(); } }); $( "#base Slider" ).slider({ value:100, min: 5, max: 200, step: 5, slide: function( event, ui ) { set Float("bconc", ui.value / 100); }, stop: function( event, ui ) { update Neutralisation(); } }); $( "#stop TSlider" ).slider({ value:500, min: 10, max: 500, step: 10, slide: function( event, ui ) { set Float("stopt", ui.value / 10); } }); page Loaded = true; }); } function draw Chart() { // Create the data table. var data = new google.visualization.Data Table(); data.add Column('number', 'Volume'); data.add Column('number', 'p H'); var rows = $("#titable tbody tr"); for (i = 0; i < rows.length; i++) data.add Row([ parse Float($( rows[i] ).children()[0].inner HTML), parse Float( $( rows[i] ).children()[1].inner HTML ) ]); // Set chart options var options = { h Axis: { title: 'Volume of strong base added / cm3', title Text Style: {color: '#FF0000', bold: 1, italic: 0, font Size: 20, font Name: 'Lucida Sans Unicode' }, view Window: { min: 0, max: 50 }, ticks: [0, 5, 10, 15, 20, 25, 30, 35, 40, 45, 50]}, v Axis: { title: 'p H', title Text Style: {color: '#FF0000', bold: 1, italic: 0, font Size: 20, font Name: 'Lucida Sans Unicode' }, view Window: { min: 0, max: 14 }, ticks: [0,1,2,3,4,5,6,7,8,9,10,11,12,13,14] }, 'chart Area': { top: 20 }, 'legend': {position: 'none'}, 'width':700, 'height':450, line Width: 3, colors: ['black'] }; // Instantiate and draw our chart, passing in some options. var chart = new google.visualization.Line Chart(document.get Element By Id('chart_div')); google.visualization.events.add Listener(chart, 'ready', function() { var gradient = create SVG('linear Gradient', {x1:0,y1:0, x2:0, y1:1}, {id:'fx'}); document.get Element By Id("chart_div").query Selector('svg>defs').append Child(gradient); gradient.append Child(create SVG('stop',{offset:'0%'})); gradient.append Child(create SVG('stop',{offset:'25%'})); gradient.append Child(create SVG('stop',{offset:'50%'})); gradient.append Child(create SVG('stop',{offset:'100%'})); $("svg").find("[clip-path]").parent().find("rect").first().attr("fill", "url(#fx)").attr("fill-opacity", "1"); change Chart Color($("#indtype").val()); }); function select Handler() { var selected Item = chart.get Selection()[0]; if (selected Item) { var p X = data.get Value(selected Item.row, 0).to Fixed(2); var p Y = data.get Value(selected Item.row, 1).to Fixed(2); $("#p X").val(p X); $("#p Y").val(p Y); } } google.visualization.events.add Listener(chart, 'select', select Handler); chart.draw(data, options) } function get Float(id) { return parse Float( $("#"+id).val() ); } function set Float(id, v) { $("#"+id).val( parse Float(v).to Fixed(2) ) ; } function calculatep Ka() { var x = (- Math.log10(get Float("Ka"))).to Fixed(2); $("#p Ka").val(x); if(get Float("p Ka")<2 || get Float("p Ka")>10) {alert("check Ka value, use scientific notation");} } function p HWA() { return -Math.log10(Math.sqrt( get Float("Ka") * get Float("aconc") )); } function p HAB(conc A, conc S) { return -Math.log10(get Float("Ka")) + Math.log10(conc S/conc A); } function p HWB(conc) { return 14+Math.log10(Math.sqrt(1e-14/get Float("Ka")*conc)); } function p HSB(conc) { return 14 + Math.log10(conc) } function calculate PH() { if ( burette Vol.to Fixed(2) == 0 ) { return p HWA(); } else if (burette Vol.to Fixed(2) == get Float("bvol").to Fixed(2) ) { return p HWB(init Mol/tot Vol); } else if (burette Vol < get Float("bvol") ) { return p HAB( parse Float( init Mol - burette Vol * get Float("bconc") * get Float("btype") ), parse Float(burette Vol * get Float("bconc") * get Float("btype")) ); } else if (burette Vol > get Float("bvol") ) { return p HSB( ( burette Vol * get Float("bconc") * get Float("btype") - init Mol ) / (tot Vol) ); } } function init Vars() { init Mol = get Float("aconc") * get Float("avol"); tot Vol = get Float("avol"); burette Vol = 0; } function titrate Step() { if (init Mol == -1) init Vars(); burette Vol += get Float("inc"); tot Vol += get Float("inc"); $("#titable tbody").html( $("#titable tbody").html() + "<tr><td>" + burette Vol.to Fixed(2) + "</td><td>" + calculate PH().to Fixed(2) + "</td><td>" + tot Vol.to Fixed(2) + "</td></tr>"); } function update Neutralisation() { set Float("bvol", (( get Float("avol") * get Float("aconc") ) / ( get Float("btype") * get Float("bconc")))); if (get Float("bvol") > 50) {alert("Titre volume cannot exceed maximum capacity of burette!");} else if (get Float("bvol") < 15) {alert("Titre volume too small, leads to large percentage error!");} reset Titrate(); } function auto Titrate() { while ( burette Vol < get Float("stopt")) { titrate Step(); } } function reset Titrate() { $("#titable tbody").html( "" ) draw Chart(); init Vars(); $("#titable tbody").html( $("#titable tbody").html() + "<tr><td>" + burette Vol.to Fixed(2) + "</td><td>" + calculate PH().to Fixed(2) + "</td><td>" + tot Vol.to Fixed(2) + "</td></tr>"); } var chart Col = {'0': ["white", "white", "white", "white"], '1': ["red", "orange", "#ffff33", "#ffff33"], '2': ["#990099", "grey", "#009933", "#009933"], '3': ["white", "white", "white","fuchsia"], '4': ["white", "white", "white","#2c5ba5"], }; function change Chart Color(ind Type) { $("#fx stop:nth-child(1)").css("stop-color",chart Col[ind Type][0]) $("#fx stop:nth-child(2)").css("stop-color",chart Col[ind Type][1]) $("#fx stop:nth-child(3)").css("stop-color",chart Col[ind Type][2]) $("#fx stop:nth-child(4)").css("stop-color",chart Col[ind Type][3]) } function check Boxes() { if (get Float("p X") == 0 && $("#WA").prop('checked')==true && $("#BS").prop('checked')==false && $("#SB").prop('checked')==false) {alert("Good job!");} else if (get Float("p X") < get Float("bvol") && get Float("p X") > 0 && $("#WA").prop('checked')==true && $("#BS").prop('checked')==true && $("#SB").prop('checked')==false) {alert("Good job!");} else if (get Float("p X") > get Float("bvol") && $("#WA").prop('checked')==false && $("#BS").prop('checked')==true && $("#SB").prop('checked')==true) {alert("Good job!");} else if (get Float("p X") == get Float("bvol") && $("#WA").prop('checked')==false && $("#BS").prop('checked')==true && $("#SB").prop('checked')==false) {alert("Good job!");} else {alert("Please try again.");} } function check Buffer() { if ( get Float("p Y") > (get Float("p Ka")-1) && get Float("p Y") < (get Float("p Ka")+1) ) { if($("#buffer").prop('checked')==true) {alert("Good job!");} else {alert("Please try again. What are the 2 components required in large excess to form a buffer?");} } if (get Float("p Y") < (get Float("p Ka")-1) || get Float("p Y") > (get Float("p Ka")+1)) { if($("#buffer").prop('checked')==false) {alert("Good job!");} else {alert("Please try again. What are the 2 components required in large excess to form a buffer?");} } } </script> <body> <ul> <li><a class="active" a href="index.html">Introduction</a></li> <li><a href="SASB.html">Strong Acid - Strong Base</a></li> <li><a href="SBSA.html">Strong Base - Strong Acid</a></li> <li><a href="WASB.html">Weak Acid - Strong Base</a></li> <li><a href="WBSA.html">Weak Base - Strong Acid</a></li> <li><a href="SBWA.html">Strong Base - Weak Acid</a></li> <li><a href="SAWB.html">Strong Acid - Weak Base</a></li> </ul> <div class="hover_img"> <p style="font-size:20px"><b>Titration Curve of Weak Acid against Strong Base</b> <a href="#">(image)<span><img src="WASB.png" height=500 border=2 ></span></a></p> </div> <table id='main Table' border=0 cellspacing=5 cellpadding=5> <tr><td><table cellpadding=5 width="20%"> <tr><td colspan=3 class='titlebg'>Set Titration Parameters</td></tr> <tr><td width="10%">[acid] = </td><td><input type='input' onchange='update Neutralisation()' class='inputbg box' size="10" id='aconc' value="1.00" /><br /><div id="acid Slider"></td><td>mol dm-3</td></tr> <tr><td>Ka (scientific notation) = </td><td><input type='input'class='inputbg box' size="10" id='Ka' value="1.80e-5" onchange='calculatep Ka(); update Neutralisation()' /></td><td>mol dm-3</td></tr> <tr><td>p Ka = </td><td><input type='input' class='box'size="10" id='p Ka' value="4.74" disabled /></td></tr> <tr><td>[base] = </td><td><input type='input' onchange='update Neutralisation()' class='inputbg box'size="10" id='bconc' value="1.00"/><br /><div id="base Slider"></td><td>mol dm-3</td></tr> <tr><td>Strong base is</td><td colspan=2><select id='btype' class='inputbg box' onchange='update Neutralisation()'> <option value=1>monoprotic</option> <option value=2>diprotic</option></select></td></tr> <tr><td>Vol of weak acid in conical flask</td><td><select id='avol' class='inputbg box' onchange="update Neutralisation();"> <option value=25>25.0</option> <option value=10>10.0</option></select></td><td>cm3</td></tr> <tr><td>Vol of strong base req for complete neutralisation</td><td><input type='input'class='box' size="10" id='bvol' value="25.00" disabled /></td><td>cm3</td></tr> <tr><td>Choice of indicator</td><td colspan=2><select id='indtype' class='inputbg box' onchange='change Chart Color(this.value)'> <option value='0'>no indicator</option> <option value='1'>methyl orange</option> <option value='2'>screened methyl orange</option> <option value='3'>phenolphthalein</option> <option value='4'>thymolphthalein</option></select></td></tr> <tr><td>Data points in increments of</td><td><select id='inc' class='inputbg box' value="1.00"> <option value=1.00>1.00</option> <option value=0.50>0.50</option> <option value=0.05>0.05 (1 drop)</option></select></td><td>cm3</td></tr> <tr><td colspan=3></td></tr> <tr><td>Stop titration at (for auto titration only)</td><td><input type='input' onchange='update Neutralisation()' class='inputbg box' size="10" id='stopt' value="50.00" /><br /><div id="stop TSlider"></td><td>cm3</td></tr> <tr><td colspan=3></td></tr> <tr> <td><input type='button' class='button greenbg' value="Do Titration Stepwise" onclick='titrate Step(); draw Chart()'></input></td> <td><input type='button' class='button redbg' value="Auto Titration" onclick='auto Titrate(); draw Chart()'></input></td> <td><input type='button' class='button' value="Reset" onclick='reset Titrate();'></input></td> </tr> </table></td> <td align=center><div id="chart_div"></div> <p class='titlebg'>Selected Point</p> Burette Volume <input type='input' class='box' size="6" id='p X' value="0.00" disabled /> p H <input type='input' class='box' size="6" id='p Y' value="0.00" disabled /><br> Select the major species present in the conical flask<br> <input type="checkbox" id="WA" value="0"> WA <input type="checkbox" id="BS" value="0"> conj base of WA <input type="checkbox" id="SB" value="0"> xs SB <input type="submit" value="Check" onclick='check Boxes()'><br> Is solution a buffer? <input type="checkbox" id="buffer" value="0"> yes <input type="submit" value="Check" onclick='check Buffer()'> </b> </td> <td> <div style='overflow:scroll; width: 200px; height:550px'> <table id="titable"> <thead><th>Burette Vol</th><th>p H</th><th>Tot Vol</th></thead> <tbody></tbody> </table> </div> </td> </tr> <html> <style type='text/css'> p {font-family: "Lucida Sans Unicode", "Lucida Grande", sans-serif; margin-top: 20px; margin-left:20px;} #main Table { width: 100%; font-family: "Lucida Sans Unicode", "Lucida Grande", sans-serif} #main Table td { vertical-align:top; font-size: 10pt; } .button { font-family: "Lucida Sans Unicode", "Lucida Grande", sans-serif; font-size: 120%; padding: 10px; width: 100% } .box { font-family: "Lucida Sans Unicode", "Lucida Grande", sans-serif; font-size: 100%; padding: 2px; } #titable th { padding: 5px; margin: 5px;} #titable td { text-align : center } .greenbg { background-color:66FF66 } .redbg { background-color:pink } .inputbg { background-color:FFFF00 } .titlebg { background-color:ccddff; font-weight: bold; line-height: 200%; text-align : center; padding: 5px; margin: 5px; width: 500px} #fx stop:nth-child(1){ stop-color: white; } #fx stop:nth-child(2){ stop-color: white; } #fx stop:nth-child(3){ stop-color: white; } ul {list-style-type: none;margin: 0;padding: 0;overflow: hidden;background-color: ccddff;} li {font-family: "Lucida Sans Unicode", "Lucida Grande", sans-serif; font-size: 80%; float: left;} li a, .dropbtn { display: inline-block; color: black; font-weight: bold; text-align: center; padding: 14px 16px; text-decoration: none; } li a:hover, .dropdown:hover .dropbtn {background-color: 99b3ff;} .hover_img a { position:relative;} .hover_img a span { position:absolute; display:none; z-index:99; background-color: ffffff; left:50%; -webkit-transform: translate X(-50%); -ms-transform: translate X(-50%); transform: translate X(-50%);} .hover_img a:hover span { display:block; } </style> <link rel="stylesheet" href="https://code.jquery.com/ui/1.11.4/themes/smoothness/jquery-ui.css"> <script src="https://ajax.googleapis.com/ajax/libs/jquery/2.2.2/jquery.min.js"></script> <script src="https://code.jquery.com/ui/1.11.4/jquery-ui.js"></script> <script src="https://rawgit.com/jmosbech/Sticky Table Headers/master/js/jquery.stickytableheaders.min.js"></script> <script type="text/javascript" src="https://www.gstatic.com/charts/loader.js"></script> <script type="text/javascript"> google.charts.load('current', {'packages':['corechart']}); // Load the Visualization API and the corechart package. google.charts.set On Load Callback(first Load); // Set a callback to run when the Google Visualization API is loaded. var burette Vol = 0; var init Mol = -1; var tot Vol = 0; function create SVG(n,a,b){ var xmlns = "http://www.w3.org/2000/svg"; var e = document.create Element NS (xmlns, n); for(var k in a){ e.set Attribute NS (null, k,a[k]); } for(var k in b){ e.set Attribute (k,b[k]); } return e; }; function first Load() { $(document).ready( function() { $("#titable tbody").html( $("#titable tbody").html() + "<tr><td>" + burette Vol.to Fixed(2) + "</td><td>" + calculate PH().to Fixed(2) + "</td><td>" + tot Vol.to Fixed(2) + "</td></tr>"); update Neutralisation(); $('#titable').sticky Table Headers({ scrollable Area: $('#titable').parent() , fixed Offset:-30 }); $( "#acid Slider" ).slider({ value:100, min: 5, max: 200, step: 5, slide: function( event, ui ) { set Float("aconc", ui.value / 100); }, stop: function( event, ui ) { update Neutralisation(); } }); $( "#base Slider" ).slider({ value:100, min: 5, max: 200, step: 5, slide: function( event, ui ) { set Float("bconc", ui.value / 100); }, stop: function( event, ui ) { update Neutralisation(); } }); $( "#stop TSlider" ).slider({ value:500, min: 10, max: 500, step: 10, slide: function( event, ui ) { set Float("stopt", ui.value / 10); } }); page Loaded = true; }); } function draw Chart() { // Create the data table. var data = new google.visualization.Data Table(); data.add Column('number', 'Volume'); data.add Column('number', 'p H'); var rows = $("#titable tbody tr"); for (i = 0; i < rows.length; i++) data.add Row([ parse Float($( rows[i] ).children()[0].inner HTML), parse Float( $( rows[i] ).children()[1].inner HTML ) ]); // Set chart options var options = { h Axis: { title: 'Volume of strong acid added / cm3', title Text Style: {color: '#FF0000', bold: 1, italic: 0, font Size: 20, font Name: 'Lucida Sans Unicode' }, view Window: { min: 0, max: 50 }, ticks: [0, 5, 10, 15, 20, 25, 30, 35, 40, 45, 50]}, v Axis: { title: 'p H', title Text Style: {color: '#FF0000', bold: 1, italic: 0, font Size: 20, font Name: 'Lucida Sans Unicode' }, view Window: { min: 0, max: 14 }, ticks: [0,1,2,3,4,5,6,7,8,9,10,11,12,13,14] }, 'chart Area': { top: 20 }, 'legend': {position: 'none'}, 'width':700, 'height':450, line Width: 3, colors: ['black'] }; // Instantiate and draw our chart, passing in some options. var chart = new google.visualization.Line Chart(document.get Element By Id('chart_div')); google.visualization.events.add Listener(chart, 'ready', function() { var gradient = create SVG('linear Gradient', {x1:0,y1:0, x2:0, y1:1}, {id:'fx'}); document.get Element By Id("chart_div").query Selector('svg>defs').append Child(gradient); gradient.append Child(create SVG('stop',{offset:'0%'})); gradient.append Child(create SVG('stop',{offset:'25%'})); gradient.append Child(create SVG('stop',{offset:'50%'})); gradient.append Child(create SVG('stop',{offset:'100%'})); $("svg").find("[clip-path]").parent().find("rect").first().attr("fill", "url(#fx)").attr("fill-opacity", "1"); change Chart Color($("#indtype").val()); }); function select Handler() { var selected Item = chart.get Selection()[0]; if (selected Item) { var p X = data.get Value(selected Item.row, 0).to Fixed(2); var p Y = data.get Value(selected Item.row, 1).to Fixed(2); $("#p X").val(p X); $("#p Y").val(p Y); } } google.visualization.events.add Listener(chart, 'select', select Handler); chart.draw(data, options) } function get Float(id) { return parse Float( $("#"+id).val() ); } function set Float(id, v) { $("#"+id).val( parse Float(v).to Fixed(2) ) ; } function calculatep Kb() { var x = (-Math.log10(get Float("Kb"))).to Fixed(2); $("#p Kb").val(x); if(get Float("p Kb")<2 || get Float("p Kb")>10) {alert("check Kb value, use scientific notation");} } function p HWB() { return 14 + Math.log10(Math.sqrt( get Float("Kb") * get Float("bconc") )); } function p HBB(conc B, conc S) { return 14 - (-Math.log10(get Float("Kb")) + (Math.log10(conc S/conc B))); } function p HWA(conc) { return -Math.log10(Math.sqrt(1e-14/get Float("Kb")*conc)); } function p HSA(conc) { return -Math.log10(conc) } function calculate PH() { if ( burette Vol.to Fixed(2) == 0 ) { return p HWB(); } else if (burette Vol.to Fixed(2) == get Float("avol").to Fixed(2) ) { return p HWA(init Mol/tot Vol); } else if (burette Vol < get Float("avol") ) { return p HBB( ( init Mol - burette Vol * get Float("aconc") * get Float("atype") ), (burette Vol * get Float("aconc") * get Float("atype")) ); } else if (burette Vol > get Float("avol") ) { return p HSA( ( burette Vol * get Float("aconc") * get Float("atype") - init Mol ) / (tot Vol) ); } } function init Vars() { init Mol = get Float("bconc") * get Float("bvol"); tot Vol = get Float("bvol"); burette Vol = 0; } function titrate Step() { if (init Mol == -1) init Vars(); burette Vol += get Float("inc"); tot Vol += get Float("inc"); $("#titable tbody").html( $("#titable tbody").html() + "<tr><td>" + burette Vol.to Fixed(2) + "</td><td>" + calculate PH().to Fixed(2) + "</td><td>" + tot Vol.to Fixed(2) + "</td></tr>"); $("#titable").parent().scroll Top( $("#titable").height() ) } function update Neutralisation() { $("#avol").val( ( ( get Float("bvol") * get Float("bconc") ) / ( get Float("atype") * get Float("aconc") ) ).to Fixed(2) ); if (get Float("avol") > 50) {alert("Titre volume cannot exceed maximum capacity of burette!");} else if (get Float("avol") < 15) {alert("Titre volume too small, leads to large percentage error!");} reset Titrate(); } function auto Titrate() { while ( burette Vol < get Float("stopt")) { titrate Step(); } } function reset Titrate() { $("#titable tbody").html( "" ) draw Chart(); init Vars(); $("#titable tbody").html( $("#titable tbody").html() + "<tr><td>" + burette Vol.to Fixed(2) + "</td><td>" + calculate PH().to Fixed(2) + "</td><td>" + tot Vol.to Fixed(2) + "</td></tr>"); } var chart Col = {'0': ["white", "white", "white", "white"], '1': ["red", "orange", "#ffff33", "#ffff33"], '2': ["#990099", "grey", "#009933", "#009933"], '3': ["white", "white", "white","fuchsia"], '4': ["white", "white", "white","#2c5ba5"], }; function change Chart Color(ind Type) { $("#fx stop:nth-child(1)").css("stop-color",chart Col[ind Type][0]) $("#fx stop:nth-child(2)").css("stop-color",chart Col[ind Type][1]) $("#fx stop:nth-child(3)").css("stop-color",chart Col[ind Type][2]) $("#fx stop:nth-child(4)").css("stop-color",chart Col[ind Type][3]) } function check Boxes() { if (get Float("p X") == 0 && $("#WB").prop('checked')==true && $("#AS").prop('checked')==false && $("#SA").prop('checked')==false) {alert("Good job!");} else if (get Float("p X") < get Float("avol") && get Float("p X") > 0 && $("#WB").prop('checked')==true && $("#AS").prop('checked')==true && $("#SA").prop('checked')==false) {alert("Good job!");} else if (get Float("p X") > get Float("avol") && $("#WB").prop('checked')==false && $("#AS").prop('checked')==true && $("#SA").prop('checked')==true) {alert("Good job!");} else if (get Float("p X") == get Float("avol") && $("#WB").prop('checked')==false && $("#AS").prop('checked')==true && $("#SA").prop('checked')==false) {alert("Good job!");} else {alert("Please try again.");} } function check Buffer() { if ( (14-get Float("p Y")) > (get Float("p Kb")-1) && (14-get Float("p Y")) < (get Float("p Kb")+1) ) { if($("#buffer").prop('checked')==true) {alert("Good job!");} else {alert("Please try again. What are the 2 components required in large excess to form a buffer?");} } else if ( (14-get Float("p Y")) < (get Float("p Kb")-1) || (14-get Float("p Y")) > (get Float("p Kb")+1) ) { if($("#buffer").prop('checked')==false) {alert("Good job!");} else {alert("Please try again. What are the 2 components required in large excess to form a buffer?");} } } </script> <body> <ul> <li><a class="active" a href="index.html">Introduction</a></li> <li><a href="SASB.html">Strong Acid - Strong Base</a></li> <li><a href="SBSA.html">Strong Base - Strong Acid</a></li> <li><a href="WASB.html">Weak Acid - Strong Base</a></li> <li><a href="WBSA.html">Weak Base - Strong Acid</a></li> <li><a href="SBWA.html">Strong Base - Weak Acid</a></li> <li><a href="SAWB.html">Strong Acid - Weak Base</a></li> </ul> <div class="hover_img"> <p style="font-size:20px"><b>Titration Curve of Weak Base against Strong Acid</b> <a href="#">(image)<span><img src="WBSA.png" height=500 border=2 ></span></a></p> </div> <table id='main Table' border=0 cellspacing=5 cellpadding=5> <tr><td><table cellpadding=5 width="20%"> <tr><td colspan=3 class='titlebg'>Set Titration Parameters</td></tr> <tr><td width="10%">[base] = </td><td><input type='input' onchange='update Neutralisation()' class='inputbg box' size="10" id='bconc' value="1.00" /><br /><div id="base Slider"></td><td>mol dm-3</td></tr> <tr><td>Kb (scientific notation) = </td><td><input type='input'class='inputbg box' size="10" id='Kb' value="1.80e-5" onchange='calculatep Kb(); update Neutralisation()' /></td><td>mol dm-3</td></tr> <tr><td>p Kb = </td><td><input type='input' class='box'size="10" id='p Kb' value="4.74" disabled /></td></tr> <tr><td>[acid] = </td><td><input type='input' onchange='update Neutralisation()' class='inputbg box'size="10" id='aconc' value="1.00"/><br /><div id="acid Slider"></td><td>mol dm-3</td></tr> <tr><td>Strong acid is</td><td colspan=2><select id='atype' class='inputbg box' onchange='update Neutralisation()'> <option value=1>monoprotic</option> <option value=2>diprotic</option></select></td></tr> <tr><td>Vol of weak base in conical flask</td><td><select id='bvol' class='inputbg box' onchange="update Neutralisation();"> <option value=25>25.0</option> <option value=10>10.0</option></select></td><td>cm3</td></tr> <tr><td>Vol of strong acid req for complete neutralisation</td><td><input type='input'class='box' size="10" id='avol' value="25.00" disabled /></td><td>cm3</td></tr> <tr><td>Choice of indicator</td><td colspan=2><select id='indtype' class='inputbg box' onchange='change Chart Color(this.value)'> <option value='0'>no indicator</option> <option value='1'>methyl orange</option> <option value='2'>screened methyl orange</option> <option value='3'>phenolphthalein</option> <option value='4'>thymolphthalein</option></select></td></tr> <tr><td>Data points in increments of</td><td><select id='inc' class='inputbg box' value="1.00"> <option value=1.00>1.00</option> <option value=0.50>0.50</option> <option value=0.05>0.05 (1 drop)</option></select></td><td>cm3</td></tr> <tr><td colspan=3></td></tr> <tr><td>Stop titration at (for auto titration only)</td><td><input type='input' onchange='update Neutralisation()' class='inputbg box' size="10" id='stopt' value="50.00" /><br /><div id="stop TSlider"></td><td>cm3</td></tr> <tr><td colspan=3></td></tr> <tr> <td><input type='button' class='button greenbg' value="Do Titration Stepwise" onclick='titrate Step(); draw Chart()'></input></td> <td><input type='button' class='button redbg' value="Auto Titration" onclick='auto Titrate(); draw Chart()'></input></td> <td><input type='button' class='button' value="Reset" onclick='reset Titrate();'></input></td> </tr> </table></td> <td align=center><div id="chart_div"></div> <p class='titlebg'>Selected Point</p> Burette Volume <input type='input' class='box' size="6" id='p X' value="0.00" disabled /> p H <input type='input' class='box' size="6" id='p Y' value="0.00" disabled /><br> Select the major species present in the conical flask<br> <input type="checkbox" id="WB" value="0"> WB <input type="checkbox" id="AS" value="0"> conj acid of WB <input type="checkbox" id="SA" value="0"> xs SA <input type="submit" value="Check" onclick='check Boxes()'><br> Is solution a buffer? <input type="checkbox" id="buffer" value="0"> yes <input type="submit" value="Check" onclick='check Buffer()'> </b> </td> <td> <div style='overflow:scroll; width: 200px; height:550px'> <table id="titable"> <thead><th>Burette Vol</th><th>p H</th><th>To preview image

1. Watch or Launch

Teacher Demonstration

Use the live model as a shared screen demonstration before students try their own predictions and observations.

Launch the Interactive

Open the simulation, adjust the controls, and compare what changes on screen before answering the concept-check questions.

Launch Interactive

Advertisement

2. Big Ideas

Key idea This interactive model helps learners test a prediction, observe the result, and explain the relationship shown in Volume of strong base added / cm3', title Text Style: {color: '#FF0000', bold: 1, italic: 0, font Size: 20, font Name: 'Lucida Sans Unicode' }, view Window: { min: 0, max: 50 }, ticks: [0, 5, 10, 15, 20, 25, 30, 35, 40, 45, 50]}, v Axis: { title: 'p H', title Text Style: {color: '#FF0000', bold: 1, italic: 0, font Size: 20, font Name: 'Lucida Sans Unicode' }, view Window: { min: 0, max: 14 }, ticks: [0,1,2,3,4,5,6,7,8,9,10,11,12,13,14] }, 'chart Area': { top: 20 }, 'legend': {position: 'none'}, 'tooltip': {is Html: true}, // This MUST be set to true for your chart to show. 'width':700, 'height':450, line Width: 3, colors: ['black'] }; // Instantiate and draw our chart, passing in some options. var chart = new google.visualization.Line Chart(document.get Element By Id('chart_div')); google.visualization.events.add Listener(chart, 'ready', function() { var gradient = create SVG('linear Gradient', {x1:0,y1:0, x2:0, y1:1}, {id:'fx'}); document.get Element By Id("chart_div").query Selector('svg>defs').append Child(gradient); gradient.append Child(create SVG('stop',{offset:'0%'})); gradient.append Child(create SVG('stop',{offset:'25%'})); gradient.append Child(create SVG('stop',{offset:'50%'})); gradient.append Child(create SVG('stop',{offset:'100%'})); $("svg").find("[clip-path]").parent().find("rect").first().attr("fill", "url(#fx)").attr("fill-opacity", "1"); change Chart Color($("#indtype").val()); }); function select Handler() { var selected Item = chart.get Selection()[0]; if (selected Item) { var p X = data.get Value(selected Item.row, 0).to Fixed(2); var p Y = data.get Value(selected Item.row, 1).to Fixed(2); $("#p X").val(p X); $("#p Y").val(p Y); } } google.visualization.events.add Listener(chart, 'select', select Handler); chart.draw(data, options) } function get Float(id) { return parse Float( $("#"+id).val() ); } function set Float(id, v) { $("#"+id).val( parse Float(v).to Fixed(2) ) ; } function p HSA(conc) { return -Math.log10(conc); } function p HSB(conc) { return 14 + Math.log10(conc) } function calculate PH() { if (burette Vol.to Fixed(2) == get Float("bvol").to Fixed(2) ) { return 7.0; } else if (burette Vol < get Float("bvol") ) { return p HSA( ( init Mol - burette Vol * get Float("bconc") * get Float("btype") ) / (tot Vol) ); } else if (burette Vol > get Float("bvol") ) { return p HSB( ( (burette Vol*get Float("bconc")*get Float("btype")-init Mol) ) / (tot Vol) ); } } function init Vars() { init Mol = get Float("aconc") * get Float("avol") * get Float("atype"); tot Vol = get Float("avol"); burette Vol = 0; tooltip Charts HTML = {}; generate Graph For Current Burette Volume(); } function generate Graph For Current Burette Volume() { var tot Acid Mol = get Float("aconc") * get Float("avol") * get Float("atype") / 1000; var acid Mol = tot Acid Mol - burette Vol * get Float("bconc") * get Float("btype") / 1000; var salt Mol = burette Vol * get Float("bconc") * get Float("btype") / 1000; if (salt Mol > tot Acid Mol) salt Mol = tot Acid Mol; var data = new google.visualization.Data Table(); data.add Column('string', 'Species Type'); data.add Column('number', 'Mols'); data.add Rows([ ["strong acid", acid Mol > 0 ? acid Mol : 0], ["salt", salt Mol], ["xs strong base", acid Mol < 0 ? -acid Mol : 0] ]); var hidden Div = document.get Element By Id('hidden_div'); var tooltip Chart = new google.visualization.Column Chart(hidden Div); var cur Burette Vol = burette Vol.to Fixed(2); // As the following function is a callback, it means that by the time it is called burette Vol may have changed. So we fixed it in a variable now google.visualization.events.add Listener(tooltip Chart, 'ready', function() { // Get the PNG of the chart and set it as the src of an img tag, to be displayed as HTML tooltip Charts HTML[cur Burette Vol] = '<img src="' + tooltip Chart.get Image URI() + '">';; }); var tooltip Options = { title: 'Amount of each species present', v Axis: { title: 'Amount / mol', title Text Style: {color: 'black', bold: 1, italic: 0, font Size: 10, font Name: 'Lucida Sans Unicode' }, view Window: { min: 0, max: get Float("aconc") * get Float("avol") * get Float("atype") / 1000 }, }, legend: {position: 'none'}, axes: { y: { 0: {label: "Amount / mol"} } } }; tooltip Chart.draw(data, tooltip Options); } function titrate Step() { if (page Loaded == false) { alert("Please wait for a while, page scripts still loading."); return; } if (init Mol == -1) init Vars(); burette Vol += get Float("inc"); tot Vol += get Float("inc"); generate Graph For Current Burette Volume( ); $("#titable tbody").html( $("#titable tbody").html() + "<tr><td>" + burette Vol.to Fixed(2) + "</td><td>" + calculate PH().to Fixed(2) + "</td><td>" + tot Vol.to Fixed(2) + "</td></tr>"); $("#titable").parent().scroll Top( $("#titable").height() ) } function update Neutralisation() { $("#bvol").val( ( ( get Float("avol") * get Float("atype") * get Float("aconc") ) / ( get Float("btype") * get Float("bconc") ) ).to Fixed(2) ); if (get Float("bvol") > 50) {alert("Titre volume cannot exceed maximum capacity of burette!");} else if (get Float("bvol") < 15) {alert("Titre volume too small, leads to large percentage error!");} reset Titrate(); } function auto Titrate() { if (page Loaded == false) { alert("Please wait for a while, page scripts still loading."); return; } if ( burette Vol < get Float("stopt")) { titrate Step(); window.set Timeout("auto Titrate()", 1); // Set a break before next function call, so that display worker gets a chance to update the display } else { draw Chart(); } } function reset Titrate() { $("#titable tbody").html( "" ) draw Chart(); init Vars(); $("#titable tbody").html( $("#titable tbody").html() + "<tr><td>" + burette Vol.to Fixed(2) + "</td><td>" + calculate PH().to Fixed(2) + "</td><td>" + tot Vol.to Fixed(2) + "</td></tr>"); } var chart Col = {'0': ["white", "white", "white", "white"], '1': ["red", "orange", "#ffff33", "#ffff33"], '2': ["#990099", "grey", "#009933", "#009933"], '3': ["white", "white", "white","fuchsia"], '4': ["white", "white", "white","#2c5ba5"], }; function change Chart Color(ind Type) { $("#fx stop:nth-child(1)").css("stop-color",chart Col[ind Type][0]) $("#fx stop:nth-child(2)").css("stop-color",chart Col[ind Type][1]) $("#fx stop:nth-child(3)").css("stop-color",chart Col[ind Type][2]) $("#fx stop:nth-child(4)").css("stop-color",chart Col[ind Type][3]) } function check Boxes() { if (get Float("p X") < get Float("bvol") && get Float("p X") > 0 && $("#SA").prop('checked')==true && $("#NS").prop('checked')==true && $("#SB").prop('checked')==false) {alert("Good job!");} else if (get Float("p X") > get Float("bvol") && $("#SA").prop('checked')==false && $("#NS").prop('checked')==true && $("#SB").prop('checked')==true) {alert("Good job!");} else if (get Float("p X") == get Float("bvol") && $("#SA").prop('checked')==false && $("#NS").prop('checked')==true && $("#SB").prop('checked')==false) {alert("Good job!");} else if (get Float("p X") == 0 && $("#SA").prop('checked')==true && $("#NS").prop('checked')==false && $("#SB").prop('checked')==false) {alert("Good job!");} else {alert("Please try again.");} } </script> <body> <ul> <li><a class="active" a href="index.html">Introduction</a></li> <li><a href="SASB.html">Strong Acid - Strong Base</a></li> <li><a href="SBSA.html">Strong Base - Strong Acid</a></li> <li><a href="WASB.html">Weak Acid - Strong Base</a></li> <li><a href="WBSA.html">Weak Base - Strong Acid</a></li> <li><a href="SBWA.html">Strong Base - Weak Acid</a></li> <li><a href="SAWB.html">Strong Acid - Weak Base</a></li> </ul> <div class="hover_img"> <p style="font-size:20px"><b>Titration Curve of Strong Acid against Strong Base</b> <a href="#">(image)<span><img src="SASB.png" height=500 border=2 ></span></a> </div> </p> <table id='main Table' border=0 cellspacing=5 cellpadding=5> <tr><td><table cellpadding=5 width="20%"> <tr><td colspan=3 class='titlebg'>Set Titration Parameters</td></tr> <tr><td width="10%">[acid] = </td><td><input type='input' onchange='update Neutralisation()' class='inputbg box' size="10" id='aconc' value="1.00" /><br /><div id="acid Slider"></td><td>mol dm-3</td></tr> <tr><td>Strong acid is</td><td colspan=2><select id='atype' class='inputbg box' onchange='update Neutralisation()'> <option value=1>monoprotic</option> <option value=2>diprotic</option></select></td></tr> <tr><td>[base] = </td><td><input type='input' onchange='update Neutralisation()' class='inputbg box'size="10" id='bconc' value="1.00"/><br /><div id="base Slider"></td><td>mol dm-3</td></tr> <tr><td>Strong base is</td><td colspan=2><select id='btype' class='inputbg box' onchange='update Neutralisation()'> <option value=1>monoprotic</option> <option value=2>diprotic</option></select></td></tr> <tr><td>Vol of strong acid in conical flask</td><td><select id='avol' class='inputbg box' onchange="update Neutralisation();"> <option value=25>25.0</option> <option value=10>10.0</option></select></td><td>cm3</td></tr> <tr><td>Vol of strong base req for complete neutralisation</td><td><input type='input'class='box' size="10" id='bvol' value="25.00" disabled /></td><td>cm3</td></tr> <tr><td>Choice of indicator</td><td colspan=2><select id='indtype' class='inputbg box' onchange='change Chart Color(this.value)'> <option value='0'>no indicator</option> <option value='1'>methyl orange</option> <option value='2'>screened methyl orange</option> <option value='3'>phenolphthalein</option> <option value='4'>thymolphthalein</option></select <html> <style type='text/css'> p {font-family: "Lucida Sans Unicode", "Lucida Grande", sans-serif; margin-top: 20px; margin-left:20px;} #main Table { width: 100%; font-family: "Lucida Sans Unicode", "Lucida Grande", sans-serif} #main Table td { vertical-align:top; font-size: 10pt; } .button { font-family: "Lucida Sans Unicode", "Lucida Grande", sans-serif; font-size: 120%; padding: 10px; width: 100% } .box { font-family: "Lucida Sans Unicode", "Lucida Grande", sans-serif; font-size: 100%; padding: 2px; } #titable th { padding: 5px; margin: 5px;} #titable td { text-align : center } .greenbg { background-color:66FF66 } .redbg { background-color:pink } .inputbg { background-color:FFFF00 } .titlebg { background-color:ccddff; font-weight: bold; line-height: 200%; text-align : center; padding: 5px; margin: 5px; width: 500px} #fx stop:nth-child(1){ stop-color: white; } #fx stop:nth-child(2){ stop-color: white; } #fx stop:nth-child(3){ stop-color: white; } ul {list-style-type: none;margin: 0;padding: 0;overflow: hidden;background-color: ccddff;} li {font-family: "Lucida Sans Unicode", "Lucida Grande", sans-serif; font-size: 80%; float: left;} li a, .dropbtn { display: inline-block; color: black; font-weight: bold; text-align: center; padding: 14px 16px; text-decoration: none; } li a:hover, .dropdown:hover .dropbtn {background-color: 99b3ff;} .hover_img a { position:relative;} .hover_img a span { position:absolute; display:none; z-index:99; background-color: ffffff; left:50%; -webkit-transform: translate X(-50%); -ms-transform: translate X(-50%); transform: translate X(-50%);} .hover_img a:hover span { display:block; } </style> <link rel="stylesheet" href="https://code.jquery.com/ui/1.11.4/themes/smoothness/jquery-ui.css"> <script src="https://ajax.googleapis.com/ajax/libs/jquery/2.2.2/jquery.min.js"></script> <script src="https://code.jquery.com/ui/1.11.4/jquery-ui.js"></script> <script src="https://rawgit.com/jmosbech/Sticky Table Headers/master/js/jquery.stickytableheaders.min.js"></script> <script type="text/javascript" src="https://www.gstatic.com/charts/loader.js"></script> <script type="text/javascript"> google.charts.load('current', {'packages':['corechart']}); // Load the Visualization API and the corechart package. google.charts.set On Load Callback(first Load); // Set a callback to run when the Google Visualization API is loaded. var burette Vol = 0; var init Mol = -1; var tot Vol = 0; function create SVG(n,a,b){ var xmlns = "http://www.w3.org/2000/svg"; var e = document.create Element NS (xmlns, n); for(var k in a){ e.set Attribute NS (null, k,a[k]); } for(var k in b){ e.set Attribute (k,b[k]); } return e; }; function first Load() { $(document).ready( function() { $("#titable tbody").html( $("#titable tbody").html() + "<tr><td>" + burette Vol.to Fixed(2) + "</td><td>" + calculate PH().to Fixed(2) + "</td><td>" + tot Vol.to Fixed(2) + "</td></tr>"); update Neutralisation(); $('#titable').sticky Table Headers({ scrollable Area: $('#titable').parent() , fixed Offset:-30 }); $( "#acid Slider" ).slider({ value:100, min: 5, max: 200, step: 5, slide: function( event, ui ) { set Float("aconc", ui.value / 100); }, stop: function( event, ui ) { update Neutralisation(); } }); $( "#base Slider" ).slider({ value:100, min: 5, max: 200, step: 5, slide: function( event, ui ) { set Float("bconc", ui.value / 100); }, stop: function( event, ui ) { update Neutralisation(); } }); $( "#stop TSlider" ).slider({ value:500, min: 10, max: 500, step: 10, slide: function( event, ui ) { set Float("stopt", ui.value / 10); } }); page Loaded = true; }); } function draw Chart() { // Create the data table. var data = new google.visualization.Data Table(); data.add Column('number', 'Volume'); data.add Column('number', 'p H'); var rows = $("#titable tbody tr"); for (i = 0; i < rows.length; i++) data.add Row([ parse Float($( rows[i] ).children()[0].inner HTML), parse Float( $( rows[i] ).children()[1].inner HTML ) ]); // Set chart options var options = { h Axis: { title: 'Volume of weak base added / cm3', title Text Style: {color: '#FF0000', bold: 1, italic: 0, font Size: 20, font Name: 'Lucida Sans Unicode' }, view Window: { min: 0, max: 50 }, ticks: [0, 5, 10, 15, 20, 25, 30, 35, 40, 45, 50]}, v Axis: { title: 'p H', title Text Style: {color: '#FF0000', bold: 1, italic: 0, font Size: 20, font Name: 'Lucida Sans Unicode' }, view Window: { min: 0, max: 14 }, ticks: [0,1,2,3,4,5,6,7,8,9,10,11,12,13,14] }, 'chart Area': { top: 20 }, 'legend': {position: 'none'}, 'width':700, 'height':450, line Width: 3, colors: ['black'] }; // Instantiate and draw our chart, passing in some options. var chart = new google.visualization.Line Chart(document.get Element By Id('chart_div')); google.visualization.events.add Listener(chart, 'ready', function() { var gradient = create SVG('linear Gradient', {x1:0,y1:0, x2:0, y1:1}, {id:'fx'}); document.get Element By Id("chart_div").query Selector('svg>defs').append Child(gradient); gradient.append Child(create SVG('stop',{offset:'0%'})); gradient.append Child(create SVG('stop',{offset:'25%'})); gradient.append Child(create SVG('stop',{offset:'50%'})); gradient.append Child(create SVG('stop',{offset:'100%'})); $("svg").find("[clip-path]").parent().find("rect").first().attr("fill", "url(#fx)").attr("fill-opacity", "1"); change Chart Color($("#indtype").val()); }); function select Handler() { var selected Item = chart.get Selection()[0]; if (selected Item) { var p X = data.get Value(selected Item.row, 0).to Fixed(2); var p Y = data.get Value(selected Item.row, 1).to Fixed(2); $("#p X").val(p X); $("#p Y").val(p Y); } } google.visualization.events.add Listener(chart, 'select', select Handler); chart.draw(data, options) } function get Float(id) { return parse Float( $("#"+id).val() ); } function set Float(id, v) { $("#"+id).val( parse Float(v).to Fixed(2) ) ; } function calculatep Kb() { var x = (-Math.log10(get Float("Kb"))).to Fixed(2); $("#p Kb").val(x); if(get Float("p Kb")<2 || get Float("p Kb")>10) {alert("check Kb value, use scientific notation");} } function p HWB() { return 14 + Math.log10(Math.sqrt( get Float("Kb") * get Float("bconc") )); } function p HBB(conc B, conc S) { return 14 - (-Math.log10(get Float("Kb")) + (Math.log10(conc S/conc B))); } function p HWA(conc) { return -Math.log10(Math.sqrt(1e-14/get Float("Kb")*conc)); } function p HSA(conc) { return -Math.log10(conc) } function calculate PH() { if ( burette Vol.to Fixed(2) == 0 ) { return p HSA(get Float("aconc") * get Float("atype")); } else if (burette Vol.to Fixed(2) == get Float("bvol").to Fixed(2) ) { return p HWA(init Mol/tot Vol); } else if (burette Vol < get Float("bvol") ) { return p HSA( (init Mol - burette Vol * get Float("bconc")) / (tot Vol) ); } else if (burette Vol > get Float("bvol") ) { return p HBB( ( burette Vol * get Float("bconc") - init Mol ), (init Mol) ); } } function init Vars() { init Mol = get Float("aconc") * get Float("avol") * get Float("atype"); tot Vol = get Float("avol"); burette Vol = 0; } function titrate Step() { if (init Mol == -1) init Vars(); burette Vol += get Float("inc"); tot Vol += get Float("inc"); $("#titable tbody").html( $("#titable tbody").html() + "<tr><td>" + burette Vol.to Fixed(2) + "</td><td>" + calculate PH().to Fixed(2) + "</td><td>" + tot Vol.to Fixed(2) + "</td></tr>"); $("#titable").parent().scroll Top( $("#titable").height() ) } function update Neutralisation() { $("#bvol").val( ( ( get Float("avol") * get Float("aconc") * get Float("atype") ) / ( get Float("bconc") ) ).to Fixed(2) ); if (get Float("bvol") > 50) {alert("Titre volume cannot exceed maximum capacity of burette!");} else if (get Float("bvol") < 15) {alert("Titre volume too small, leads to large percentage error!");} reset Titrate(); } function auto Titrate() { while ( burette Vol < get Float("stopt")) { titrate Step(); } } function reset Titrate() { $("#titable tbody").html( "" ) draw Chart(); init Vars(); $("#titable tbody").html( $("#titable tbody").html() + "<tr><td>" + burette Vol.to Fixed(2) + "</td><td>" + calculate PH().to Fixed(2) + "</td><td>" + tot Vol.to Fixed(2) + "</td></tr>"); } var chart Col = {'0': ["white", "white", "white", "white"], '1': ["red", "orange", "#ffff33", "#ffff33"], '2': ["#990099", "grey", "#009933", "#009933"], '3': ["white", "white", "white","fuchsia"], '4': ["white", "white", "white","#2c5ba5"], }; function change Chart Color(ind Type) { $("#fx stop:nth-child(1)").css("stop-color",chart Col[ind Type][0]) $("#fx stop:nth-child(2)").css("stop-color",chart Col[ind Type][1]) $("#fx stop:nth-child(3)").css("stop-color",chart Col[ind Type][2]) $("#fx stop:nth-child(4)").css("stop-color",chart Col[ind Type][3]) } function check Boxes() { if (get Float("p X") == 0 && $("#WB").prop('checked')==false && $("#AS").prop('checked')==false && $("#SA").prop('checked')==true) {alert("Good job!");} else if (get Float("p X") < get Float("bvol") && get Float("p X") > 0 && $("#WB").prop('checked')==false && $("#AS").prop('checked')==true && $("#SA").prop('checked')==true) {alert("Good job!");} else if (get Float("p X") > get Float("bvol") && $("#WB").prop('checked')==true && $("#AS").prop('checked')==true && $("#SA").prop('checked')==false) {alert("Good job!");} else if (get Float("p X") == get Float("bvol") && $("#WB").prop('checked')==false && $("#AS").prop('checked')==true && $("#SA").prop('checked')==false) {alert("Good job!");} else {alert("Please try again.");} } function check Buffer() { if ( (14-get Float("p Y")) > (get Float("p Kb")-1) && (14-get Float("p Y")) < (get Float("p Kb")+1) ) { if($("#buffer").prop('checked')==true) {alert("Good job!");} else {alert("Please try again. What are the 2 components required in large excess to form a buffer?");} } else if ( (14-get Float("p Y")) < (get Float("p Kb")-1) || (14-get Float("p Y")) > (get Float("p Kb")+1) ) { if($("#buffer").prop('checked')==false) {alert("Good job!");} else {alert("Please try again. What are the 2 components required in large excess to form a buffer?");} } } </script> <body> <ul> <li><a class="active" a href="index.html">Introduction</a></li> <li><a href="SASB.html">Strong Acid - Strong Base</a></li> <li><a href="SBSA.html">Strong Base - Strong Acid</a></li> <li><a href="WASB.html">Weak Acid - Strong Base</a></li> <li><a href="WBSA.html">Weak Base - Strong Acid</a></li> <li><a href="SBWA.html">Strong Base - Weak Acid</a></li> <li><a href="SAWB.html">Strong Acid - Weak Base</a></li> </ul> <div class="hover_img"> <p style="font-size:20px"><b>Titration Curve of Strong Acid against Weak Base</b> <a href="#">(image)<span><img src="SAWB.png" height=500 border=2 ></span></a></p> </div> <table id='main Table' border=0 cellspacing=5 cellpadding=5> <tr><td><table cellpadding=5 width="20%"> <tr><td colspan=3 class='titlebg'>Set Titration Parameters</td></tr> <tr><td>[acid] = </td><td><input type='input' onchange='update Neutralisation()' class='inputbg box'size="10" id='aconc' value="1.00"/><br /><div id="acid Slider"></td><td>mol dm-3</td></tr> <tr><td>Strong acid is</td><td colspan=2><select id='atype' class='inputbg box' onchange='update Neutralisation()'> <option value=1>monoprotic</option> <option value=2>diprotic</option></select></td></tr> <tr><td width="10%">[base] = </td><td><input type='input' onchange='update Neutralisation()' class='inputbg box' size="10" id='bconc' value="1.00" /><br /><div id="base Slider"></td><td>mol dm-3</td></tr> <tr><td>Kb (scientific notation) = </td><td><input type='input'class='inputbg box' size="10" id='Kb' value="1.80e-5" onchange='calculatep Kb(); update Neutralisation()' /></td><td>mol dm-3</td></tr> <tr><td>p Kb = </td><td><input type='input' class='box'size="10" id='p Kb' value="4.74" disabled /></td></tr> <tr><td>Vol of strong acid in conical flask</td><td><select id='avol' class='inputbg box' onchange="update Neutralisation();"> <option value=25>25.0</option> <option value=10>10.0</option></select></td><td>cm3</td></tr> <tr><td>Vol of weak base req for complete neutralisation</td><td><input type='input'class='box' size="10" id='bvol' value="25.00" disabled /></td><td>cm3</td></tr> <tr><td>Choice of indicator</td><td colspan=2><select id='indtype' class='inputbg box' onchange='change Chart Color(this.value)'> <option value='0'>no indicator</option> <option value='1'>methyl orange</option> <option value='2'>screened methyl orange</option> <option value='3'>phenolphthalein</option> <option value='4'>thymolphthalein</option></select></td></tr> <tr><td>Data points in increments of</td><td><select id='inc' class='inputbg box' value="1.00"> <option value=1.00>1.00</option> <option value=0.50>0.50</option> <option value=0.05>0.05 (1 drop)</option></select></td><td>cm3</td></tr> <tr><td colspan=3></td></tr> <tr><td>Stop titration at (for auto titration only)</td><td><input type='input' onchange='update Neutralisation()' class='inputbg box' size="10" id='stopt' value="50.00" /><br /><div id="stop TSlider"></td><td>cm3</td></tr> <tr><td colspan=3></td></tr> <tr> <td><input type='button' class='button greenbg' value="Do Titration Stepwise" onclick='titrate Step(); draw Chart()'></input></td> <td><input type='button' class='button redbg' value="Auto Titration" onclick='auto Titrate(); draw Chart()'></input></td> <td><input type='button' class='button' value="Reset" onclick='reset Titrate();'></input></td> </tr> </table></td> <td align=center><div id="chart_div"></div> <p class='titlebg'>Selected Point</p> Burette Volume <input type='input' class='box' size="6" id='p X' value="0.00" disabled /> p H <input type='input' class='box' size="6" id='p Y' value="0.00" disabled /><br> Select the major species present in the conical flask<br> <input type="checkbox" id="SA" value="0"> SA <input type="checkbox" id="AS" value="0"> conj acid of WB <input type="checkbox" id="WB" value="0"> xs WB <input type="submit" value="Check" onclick='check Boxes()'><br> Is solution a buffer? <input type="checkbox" id="buffer" value="0"> yes <input type="submit" value="Check" onclick='check Buffer()'> </b> </td> <td> <div style='overflow:scroll; width: 200px; height:550px'> <table id="titable"> <thead><th>Burette Vol</th><th>p H</th><th>Total Vol</th></thead> <html> <style type='text/css'> p {font-family: "Lucida Sans Unicode", "Lucida Grande", sans-serif; margin-top: 20px; margin-left:20px;} #main Table { width: 100%; font-family: "Lucida Sans Unicode", "Lucida Grande", sans-serif} #main Table td { vertical-align:top; font-size: 10pt; } .button { font-family: "Lucida Sans Unicode", "Lucida Grande", sans-serif; font-size: 120%; padding: 10px; width: 100% } .box { font-family: "Lucida Sans Unicode", "Lucida Grande", sans-serif; font-size: 100%; padding: 2px; } #titable th { padding: 5px; margin: 5px;} #titable td { text-align : center } .greenbg { background-color:66FF66 } .redbg { background-color:pink } .inputbg { background-color:FFFF00 } .titlebg { background-color:ccddff; font-weight: bold; line-height: 200%; text-align : center; padding: 5px; margin: 5px; width: 500px} #fx stop:nth-child(1){ stop-color: white; } #fx stop:nth-child(2){ stop-color: white; } #fx stop:nth-child(3){ stop-color: white; } ul {list-style-type: none;margin: 0;padding: 0;overflow: hidden;background-color: ccddff;} li {font-family: "Lucida Sans Unicode", "Lucida Grande", sans-serif; font-size: 80%; float: left;} li a, .dropbtn { display: inline-block; color: black; font-weight: bold; text-align: center; padding: 14px 16px; text-decoration: none; } li a:hover, .dropdown:hover .dropbtn {background-color: 99b3ff;} .hover_img a { position:relative;} .hover_img a span { position:absolute; display:none; z-index:99; background-color: ffffff; left:50%; -webkit-transform: translate X(-50%); -ms-transform: translate X(-50%); transform: translate X(-50%);} .hover_img a:hover span { display:block; } </style> <link rel="stylesheet" href="https://code.jquery.com/ui/1.11.4/themes/smoothness/jquery-ui.css"> <script src="https://ajax.googleapis.com/ajax/libs/jquery/2.2.2/jquery.min.js"></script> <script src="https://code.jquery.com/ui/1.11.4/jquery-ui.js"></script> <script src="https://rawgit.com/jmosbech/Sticky Table Headers/master/js/jquery.stickytableheaders.min.js"></script> <script type="text/javascript" src="https://www.gstatic.com/charts/loader.js"></script> <script type="text/javascript"> google.charts.load('current', {'packages':['corechart']}); // Load the Visualization API and the corechart package. google.charts.set On Load Callback(first Load); // Set a callback to run when the Google Visualization API is loaded. var burette Vol = 0; var init Mol = -1; var tot Vol = 0; function create SVG(n,a,b){ var xmlns = "http://www.w3.org/2000/svg"; var e = document.create Element NS (xmlns, n); for(var k in a){ e.set Attribute NS (null, k,a[k]); } for(var k in b){ e.set Attribute (k,b[k]); } return e; }; function first Load() { $(document).ready( function() { $("#titable tbody").html( $("#titable tbody").html() + "<tr><td>" + burette Vol.to Fixed(2) + "</td><td>" + calculate PH().to Fixed(2) + "</td><td>" + tot Vol.to Fixed(2) + "</td></tr>"); update Neutralisation(); $('#titable').sticky Table Headers({ scrollable Area: $('#titable').parent() , fixed Offset:-30 }); $( "#acid Slider" ).slider({ value:100, min: 5, max: 200, step: 5, slide: function( event, ui ) { set Float("aconc", ui.value / 100); }, stop: function( event, ui ) { update Neutralisation(); } }); $( "#base Slider" ).slider({ value:100, min: 5, max: 200, step: 5, slide: function( event, ui ) { set Float("bconc", ui.value / 100); }, stop: function( event, ui ) { update Neutralisation(); } }); $( "#stop TSlider" ).slider({ value:500, min: 10, max: 500, step: 10, slide: function( event, ui ) { set Float("stopt", ui.value / 10); } }); page Loaded = true; }); } function draw Chart() { // Create the data table. var data = new google.visualization.Data Table(); data.add Column('number', 'Volume'); data.add Column('number', 'p H'); var rows = $("#titable tbody tr"); for (i = 0; i < rows.length; i++) data.add Row([ parse Float($( rows[i] ).children()[0].inner HTML), parse Float( $( rows[i] ).children()[1].inner HTML ) ]); // Set chart options var options = { h Axis: { title: 'Volume of strong acid added / cm3', title Text Style: {color: '#FF0000', bold: 1, italic: 0, font Size: 20, font Name: 'Lucida Sans Unicode' }, view Window: { min: 0, max: 50 }, ticks: [0, 5, 10, 15, 20, 25, 30, 35, 40, 45, 50]}, v Axis: { title: 'p H', title Text Style: {color: '#FF0000', bold: 1, italic: 0, font Size: 20, font Name: 'Lucida Sans Unicode' }, view Window: { min: 0, max: 14 }, ticks: [0,1,2,3,4,5,6,7,8,9,10,11,12,13,14] }, 'chart Area': { top: 20 }, 'legend': {position: 'none'}, 'width':700, 'height':450, line Width: 3, colors: ['black'] }; // Instantiate and draw our chart, passing in some options. var chart = new google.visualization.Line Chart(document.get Element By Id('chart_div')); google.visualization.events.add Listener(chart, 'ready', function() { var gradient = create SVG('linear Gradient', {x1:0,y1:0, x2:0, y1:1}, {id:'fx'}); document.get Element By Id("chart_div").query Selector('svg>defs').append Child(gradient); gradient.append Child(create SVG('stop',{offset:'0%'})); gradient.append Child(create SVG('stop',{offset:'25%'})); gradient.append Child(create SVG('stop',{offset:'50%'})); gradient.append Child(create SVG('stop',{offset:'100%'})); $("svg").find("[clip-path]").parent().find("rect").first().attr("fill", "url(#fx)").attr("fill-opacity", "1"); change Chart Color($("#indtype").val()); }); function select Handler() { var selected Item = chart.get Selection()[0]; if (selected Item) { set Float( "p X", data.get Value(selected Item.row, 0) ); set Float( "p Y", data.get Value(selected Item.row, 1) ); } } google.visualization.events.add Listener(chart, 'select', select Handler); chart.draw(data, options) } function get Float(id) { return parse Float( $("#"+id).val() ); } function set Float(id, v) { $("#"+id).val( parse Float(v).to Fixed(2) ) ; } function p HSA(conc) { return -Math.log10(conc); } function p HSB(conc) { return 14 + Math.log10(conc) } function calculate PH() { if (burette Vol.to Fixed(2) == get Float("avol").to Fixed(2) ){ return 7.0; } else if (burette Vol < get Float("avol") ) { return p HSB( ( init Mol - burette Vol * get Float("aconc") * get Float("atype") ) / (tot Vol) ); } else if (burette Vol > get Float("avol") ) { return p HSA(( ( burette Vol * get Float("aconc") * get Float("atype") ) - init Mol ) / (tot Vol) ); } } function init Vars() { init Mol = get Float("bconc") * get Float("bvol") * get Float("btype"); tot Vol = get Float("bvol"); burette Vol = 0; } function titrate Step() { if (init Mol == -1) init Vars(); burette Vol += get Float("inc"); tot Vol += get Float("inc"); $("#titable tbody").html( $("#titable tbody").html() + "<tr><td>" + burette Vol.to Fixed(2) + "</td><td>" + calculate PH().to Fixed(2) + "</td><td>" + tot Vol.to Fixed(2) + "</td></tr>"); $("#titable").parent().scroll Top( $("#titable").height() ) } function update Neutralisation() { set Float("avol", get Float("bvol") * get Float("btype") * get Float("bconc") / (get Float("atype") * get Float("aconc")) ); if (get Float("avol") > 50) {alert("Titre volume cannot exceed maximum capacity of burette!");} else if (get Float("avol") < 15) {alert("Titre volume too small, leads to large percentage error!");} reset Titrate(); } function auto Titrate() { while ( burette Vol < get Float("stopt")) { titrate Step(); } } function reset Titrate() { $("#titable tbody").html( "" ) draw Chart(); init Vars(); $("#titable tbody").html( $("#titable tbody").html() + "<tr><td>" + burette Vol.to Fixed(2) + "</td><td>" + calculate PH().to Fixed(2) + "</td><td>" + tot Vol.to Fixed(2) + "</td></tr>"); } var chart Col = {'0': ["white", "white", "white", "white"], '1': ["red", "orange", "#ffff33", "#ffff33"], '2': ["#990099", "grey", "#009933", "#009933"], '3': ["white", "white", "white","fuchsia"], '4': ["white", "white", "white","#2c5ba5"], }; function change Chart Color(ind Type) { $("#fx stop:nth-child(1)").css("stop-color",chart Col[ind Type][0]) $("#fx stop:nth-child(2)").css("stop-color",chart Col[ind Type][1]) $("#fx stop:nth-child(3)").css("stop-color",chart Col[ind Type][2]) $("#fx stop:nth-child(4)").css("stop-color",chart Col[ind Type][3]) } function check Boxes() { if (get Float("p X") < get Float("avol") && get Float("p X") > 0 && $("#SB").prop('checked')==true && $("#NS").prop('checked')==true && $("#SA").prop('checked')==false) {alert("Good job!");} else if (get Float("p X") > get Float("avol") && $("#SB").prop('checked')==false && $("#NS").prop('checked')==true && $("#SA").prop('checked')==true) {alert("Good job!");} else if (get Float("p X") == get Float("avol") && $("#SB").prop('checked')==false && $("#NS").prop('checked')==true && $("#SA").prop('checked')==false) {alert("Good job!");} else if (get Float("p X") == 0 && $("#SB").prop('checked')==true && $("#NS").prop('checked')==false && $("#SA").prop('checked')==false) {alert("Good job!");} else {alert("Please try again.");} } </script> <body> <ul> <li><a class="active" a href="index.html">Introduction</a></li> <li><a href="SASB.html">Strong Acid - Strong Base</a></li> <li><a href="SBSA.html">Strong Base - Strong Acid</a></li> <li><a href="WASB.html">Weak Acid - Strong Base</a></li> <li><a href="WBSA.html">Weak Base - Strong Acid</a></li> <li><a href="SBWA.html">Strong Base - Weak Acid</a></li> <li><a href="SAWB.html">Strong Acid - Weak Base</a></li> </ul> <div class="hover_img"> <p style="font-size:20px"><b>Titration Curve of Strong Base against Strong Acid</b> <a href="#">(image)<span><img src="SBSA.png" height=500 border=2 ></span></a></p> </div> <table id='main Table' border=0 cellspacing=5 cellpadding=5> <tr><td><table cellpadding=5 width="20%"> <tr><td colspan=3 class='titlebg'>Set Titration Parameters</td></tr> <tr><td>[base] = </td><td><input type='input' onchange='update Neutralisation()' class='inputbg box'size="10" id='bconc' value="1.00"/><br /><div id="base Slider"></td><td>mol dm-3</td></tr> <tr><td>Strong base is</td><td colspan=2><select id='btype' class='inputbg box' onchange='update Neutralisation()'> <option value=1>monoprotic</option> <option value=2>diprotic</option></select></td></tr> <tr><td width="10%">[acid] = </td><td><input type='input' onchange='update Neutralisation()' class='inputbg box' size="10" id='aconc' value="1.00" /><br /><div id="acid Slider"></td><td>mol dm-3</td></tr> <tr><td>Strong acid is</td><td colspan=2><select id='atype' class='inputbg box' onchange='update Neutralisation()'> <option value=1>monoprotic</option> <option value=2>diprotic</option></select></td></tr> <tr><td>Vol of strong base in conical flask</td><td><select id='bvol' class='inputbg box' onchange="update Neutralisation();"> <option value=25>25.0</option> <option value=10>10.0</option></select></td><td>cm3</td></tr> <tr><td>Vol of strong acid req for complete neutralisation</td><td><input type='input'class='box' size="10" id='avol' value="25.00" disabled /></td><td>cm3</td></tr> <tr><td>Choice of indicator</td><td colspan=2><select id='indtype' class='inputbg box' onchange='change Chart Color(this.value)'> <option value='0'>no indicator</option> <option value='1'>methyl orange</option> <option value='2'>screened methyl orange</option> <option value='3'>phenolphthalein</option> <option value='4'>thymolphthalein</option></select></td></tr> <tr><td>Data points in increments of</td><td><select id='inc' class='inputbg box' value="1.00"> <option value=1.00>1.00</option> <option value=0.50>0.50</option> <option value=0.05>0.05 (1 drop)</option></select></td><td>cm3</td></tr> <tr><td colspan=3></td></tr> <tr><td>Stop titration at (for auto titration only)</td><td><input type='input' onchange='update Neutralisation()' class='inputbg box' size="10" id='stopt' value="50.00" /><br /><div id="stop TSlider"></td><td>cm3</td></tr> <tr><td colspan=3></td></tr> <tr> <td><input type='button' class='button greenbg' value="Do Titration Stepwise" onclick='titrate Step(); draw Chart()'></input></td> <td><input type='button' class='button redbg' value="Auto Titration" onclick='auto Titrate(); draw Chart()'></input></td> <td><input type='button' class='button' value="Reset" onclick='reset Titrate();'></input></td> </tr> </table></td> <td align=center><div id="chart_div"></div> <p class='titlebg'>Selected Point</p> Burette Volume <input type='input' class='box' size="6" id='p X' value="0.00" disabled /> p H <input type='input' class='box' size="6" id='p Y' value="0.00" disabled /><br> Select all the species present in the conical flask<br> <input type="checkbox" id="SB" value="0"> strong base <input type="checkbox" id="NS" value="0"> neutral salt <input type="checkbox" id="SA" value="0"> strong acid <input type="submit" value="Check" onclick='check Boxes()'> </b> </td> <td> <div style='overflow:scroll; width: 200px; height:550px'> <table id="titable"> <thead><th>Burette Vol</th><th>p H</th><th>Total Vol</th></thead> <tbody></tbody> </table> </div> </td> </tr> </table> </body> </html> <html> <style type='text/css'> p {font-family: "Lucida Sans Unicode", "Lucida Grande", sans-serif; margin-top: 20px; margin-left:20px;} #main Table { width: 100%; font-family: "Lucida Sans Unicode", "Lucida Grande", sans-serif} #main Table td { vertical-align:top; font-size: 10pt; } .button { font-family: "Lucida Sans Unicode", "Lucida Grande", sans-serif; font-size: 120%; padding: 10px; width: 100% } .box { font-family: "Lucida Sans Unicode", "Lucida Grande", sans-serif; font-size: 100%; padding: 2px; } #titable th { padding: 5px; margin: 5px;} #titable td { text-align : center } .greenbg { background-color:66FF66 } .redbg { background-color:pink } .inputbg { background-color:FFFF00 } .titlebg { background-color:ccddff; font-weight: bold; line-height: 200%; text-align : center; padding: 5px; margin: 5px; width: 500px} #fx stop:nth-child(1){ stop-color: white; } #fx stop:nth-child(2){ stop-color: white; } #fx stop:nth-child(3){ stop-color: white; } ul {list-style-type: none;margin: 0;padding: 0;overflow: hidden;background-color: ccddff;} li {font-family: "Lucida Sans Unicode", "Lucida Grande", sans-serif; font-size: 80%; float: left;} li a, .dropbtn { display: inline-block; color: black; font-weight: bold; text-align: center; padding: 14px 16px; text-decoration: none; } li a:hover, .dropdown:hover .dropbtn {background-color: 99b3ff;} .hover_img a { position:relative;} .hover_img a span { position:absolute; display:none; z-index:99; background-color: ffffff; left:50%; -webkit-transform: translate X(-50%); -ms-transform: translate X(-50%); transform: translate X(-50%);} .hover_img a:hover span { display:block; } </style> <link rel="stylesheet" href="https://code.jquery.com/ui/1.11.4/themes/smoothness/jquery-ui.css"> <script src="https://ajax.googleapis.com/ajax/libs/jquery/2.2.2/jquery.min.js"></script> <script src="https://code.jquery.com/ui/1.11.4/jquery-ui.js"></script> <script src="https://rawgit.com/jmosbech/Sticky Table Headers/master/js/jquery.stickytableheaders.min.js"></script> <script type="text/javascript" src="https://www.gstatic.com/charts/loader.js"></script> <script type="text/javascript"> google.charts.load('current', {'packages':['corechart']}); // Load the Visualization API and the corechart package. google.charts.set On Load Callback(first Load); // Set a callback to run when the Google Visualization API is loaded. var burette Vol = 0; var init Mol = -1; var tot Vol = 0; function create SVG(n,a,b){ var xmlns = "http://www.w3.org/2000/svg"; var e = document.create Element NS (xmlns, n); for(var k in a){ e.set Attribute NS (null, k,a[k]); } for(var k in b){ e.set Attribute (k,b[k]); } return e; }; function first Load() { $(document).ready( function() { $("#titable tbody").html( $("#titable tbody").html() + "<tr><td>" + burette Vol.to Fixed(2) + "</td><td>" + calculate PH().to Fixed(2) + "</td><td>" + tot Vol.to Fixed(2) + "</td></tr>"); update Neutralisation(); $('#titable').sticky Table Headers({ scrollable Area: $('#titable').parent() , fixed Offset:-30 }); $( "#acid Slider" ).slider({ value:100, min: 5, max: 200, step: 5, slide: function( event, ui ) { set Float("aconc", ui.value / 100); }, stop: function( event, ui ) { update Neutralisation(); } }); $( "#base Slider" ).slider({ value:100, min: 5, max: 200, step: 5, slide: function( event, ui ) { set Float("bconc", ui.value / 100); }, stop: function( event, ui ) { update Neutralisation(); } }); $( "#stop TSlider" ).slider({ value:500, min: 10, max: 500, step: 10, slide: function( event, ui ) { set Float("stopt", ui.value / 10); } }); page Loaded = true; }); } function draw Chart() { // Create the data table. var data = new google.visualization.Data Table(); data.add Column('number', 'Volume'); data.add Column('number', 'p H'); var rows = $("#titable tbody tr"); for (i = 0; i < rows.length; i++) data.add Row([ parse Float($( rows[i] ).children()[0].inner HTML), parse Float( $( rows[i] ).children()[1].inner HTML ) ]); // Set chart options var options = { h Axis: { title: 'Volume of weak acid added / cm3', title Text Style: {color: '#FF0000', bold: 1, italic: 0, font Size: 20, font Name: 'Lucida Sans Unicode' }, view Window: { min: 0, max: 50 }, ticks: [0, 5, 10, 15, 20, 25, 30, 35, 40, 45, 50]}, v Axis: { title: 'p H', title Text Style: {color: '#FF0000', bold: 1, italic: 0, font Size: 20, font Name: 'Lucida Sans Unicode' }, view Window: { min: 0, max: 14 }, ticks: [0,1,2,3,4,5,6,7,8,9,10,11,12,13,14] }, 'chart Area': { top: 20 }, 'legend': {position: 'none'}, 'width':700, 'height':450, line Width: 3, colors: ['black'] }; // Instantiate and draw our chart, passing in some options. var chart = new google.visualization.Line Chart(document.get Element By Id('chart_div')); google.visualization.events.add Listener(chart, 'ready', function() { var gradient = create SVG('linear Gradient', {x1:0,y1:0, x2:0, y1:1}, {id:'fx'}); document.get Element By Id("chart_div").query Selector('svg>defs').append Child(gradient); gradient.append Child(create SVG('stop',{offset:'0%'})); gradient.append Child(create SVG('stop',{offset:'25%'})); gradient.append Child(create SVG('stop',{offset:'50%'})); gradient.append Child(create SVG('stop',{offset:'100%'})); $("svg").find("[clip-path]").parent().find("rect").first().attr("fill", "url(#fx)").attr("fill-opacity", "1"); change Chart Color($("#indtype").val()); }); function select Handler() { var selected Item = chart.get Selection()[0]; if (selected Item) { var p X = data.get Value(selected Item.row, 0).to Fixed(2); var p Y = data.get Value(selected Item.row, 1).to Fixed(2); $("#p X").val(p X); $("#p Y").val(p Y); } } google.visualization.events.add Listener(chart, 'select', select Handler); chart.draw(data, options) } function get Float(id) { return parse Float( $("#"+id).val() ); } function set Float(id, v) { $("#"+id).val( parse Float(v).to Fixed(2) ) ; } function calculatep Ka() { var x = (- Math.log10(get Float("Ka"))).to Fixed(2); $("#p Ka").val(x); if(get Float("p Ka")<2 || get Float("p Ka")>10) {alert("check Ka value, use scientific notation");} } function p HWA() { return -Math.log10(Math.sqrt( get Float("Ka") * get Float("aconc") )); } function p HAB(conc A, conc S) { return -Math.log10(get Float("Ka")) + (Math.log10(conc S/conc A)); } //not tested function p HWB(conc) { return 14+Math.log10(Math.sqrt(1e-14/get Float("Ka")*conc)); } function p HSB(conc) { return 14 + Math.log10(conc) } function calculate PH() { if ( burette Vol.to Fixed(2) == 0 ) { return p HSB(get Float("bconc") * get Float("btype")); } else if (burette Vol.to Fixed(2) == get Float("avol").to Fixed(2) ) { return p HWB(init Mol/tot Vol); } else if (burette Vol < get Float("avol") ) { return p HSB( (init Mol - burette Vol * get Float("aconc") ) / tot Vol ); } else if (burette Vol > get Float("avol") ) { return p HAB( ( burette Vol * get Float("aconc") - init Mol ) , init Mol ); } } function init Vars() { init Mol = get Float("bconc") * get Float("bvol") * get Float("btype"); tot Vol = get Float("bvol"); burette Vol = 0; } function titrate Step() { if (init Mol == -1) init Vars(); burette Vol += get Float("inc"); tot Vol += get Float("inc"); $("#titable tbody").html( $("#titable tbody").html() + "<tr><td>" + burette Vol.to Fixed(2) + "</td><td>" + calculate PH().to Fixed(2) + "</td><td>" + tot Vol.to Fixed(2) + "</td></tr>"); $("#titable").parent().scroll Top( $("#titable").height() ) } function update Neutralisation() { $("#avol").val( ( get Float("bvol") * get Float("bconc") * get Float("btype") / get Float("aconc") ).to Fixed(2) ); if (get Float("avol") > 50) {alert("Titre volume cannot exceed maximum capacity of burette!");} else if (get Float("avol") < 15) {alert("Titre volume too small, leads to large percentage error!");} reset Titrate(); } function auto Titrate() { while ( burette Vol < get Float("stopt")) { titrate Step(); } } function reset Titrate() { $("#titable tbody").html( "" ) draw Chart(); init Vars(); $("#titable tbody").html( $("#titable tbody").html() + "<tr><td>" + burette Vol.to Fixed(2) + "</td><td>" + calculate PH().to Fixed(2) + "</td><td>" + tot Vol.to Fixed(2) + "</td></tr>"); } var chart Col = {'0': ["white", "white", "white", "white"], '1': ["red", "orange", "#ffff33", "#ffff33"], '2': ["#990099", "grey", "#009933", "#009933"], '3': ["white", "white", "white","fuchsia"], '4': ["white", "white", "white","#2c5ba5"], }; function change Chart Color(ind Type) { $("#fx stop:nth-child(1)").css("stop-color",chart Col[ind Type][0]) $("#fx stop:nth-child(2)").css("stop-color",chart Col[ind Type][1]) $("#fx stop:nth-child(3)").css("stop-color",chart Col[ind Type][2]) $("#fx stop:nth-child(4)").css("stop-color",chart Col[ind Type][3]) } function check Boxes() { if (get Float("p X") == 0 && $("#WA").prop('checked')==false && $("#BS").prop('checked')==false && $("#SB").prop('checked')==true) {alert("Good job!");} else if (get Float("p X") < get Float("avol") && get Float("p X") > 0 && $("#WA").prop('checked')==false && $("#BS").prop('checked')==true && $("#SB").prop('checked')==true) {alert("Good job!");} else if (get Float("p X") > get Float("avol") && $("#WA").prop('checked')==true && $("#BS").prop('checked')==true && $("#SB").prop('checked')==false) {alert("Good job!");} else if (get Float("p X") == get Float("avol") && $("#WA").prop('checked')==false && $("#BS").prop('checked')==true && $("#SB").prop('checked')==false) {alert("Good job!");} else {alert("Please try again.");} } function check Buffer() { if ( get Float("p Y") > (get Float("p Ka")-1) && get Float("p Y") < (get Float("p Ka")+1) ) { if($("#buffer").prop('checked')==true) {alert("Good job!");} else {alert("Please try again. What are the 2 components required in large excess to form a buffer?");} } if (get Float("p Y") < (get Float("p Ka")-1) || get Float("p Y") > (get Float("p Ka")+1)) { if($("#buffer").prop('checked')==false) {alert("Good job!");} else {alert("Please try again. What are the 2 components required in large excess to form a buffer?");} } } </script> <body> <ul> <li><a class="active" a href="index.html">Introduction</a></li> <li><a href="SASB.html">Strong Acid - Strong Base</a></li> <li><a href="SBSA.html">Strong Base - Strong Acid</a></li> <li><a href="WASB.html">Weak Acid - Strong Base</a></li> <li><a href="WBSA.html">Weak Base - Strong Acid</a></li> <li><a href="SBWA.html">Strong Base - Weak Acid</a></li> <li><a href="SAWB.html">Strong Acid - Weak Base</a></li> </ul> <div class="hover_img"> <p style="font-size:20px"><b>Titration Curve of Strong Base against Weak Acid</b> <a href="#">(image)<span><img src="SBWA.png" height=500 border=2 ></span></a></p> </div> <table id='main Table' border=0 cellspacing=5 cellpadding=5> <tr><td><table cellpadding=5 width="20%"> <tr><td colspan=3 class='titlebg'>Set Titration Parameters</td></tr> <tr><td>[base] = </td><td><input type='input' onchange='update Neutralisation()' class='inputbg box'size="10" id='bconc' value="1.00"/><br /><div id="base Slider"></td><td>mol dm-3</td></tr> <tr><td>Strong base is</td><td colspan=2><select id='btype' class='inputbg box' onchange='update Neutralisation()'> <option value=1>monoprotic</option> <option value=2>diprotic</option></select></td></tr> <tr><td width="10%">[acid] = </td><td><input type='input' onchange='update Neutralisation()' class='inputbg box' size="10" id='aconc' value="1.00" /><br /><div id="acid Slider"></td><td>mol dm-3</td></tr> <tr><td>Ka (scientific notation) = </td><td><input type='input'class='inputbg box' size="10" id='Ka' value="1.80e-5" onchange='calculatep Ka(); update Neutralisation()' /></td><td>mol dm-3</td></tr> <tr><td>p Ka = </td><td><input type='input' class='box'size="10" id='p Ka' value="4.74" disabled /></td></tr> <tr><td>Vol of strong base in conical flask</td><td><select id='bvol' class='inputbg box' onchange="update Neutralisation();"> <option value=25>25.0</option> <option value=10>10.0</option></select></td><td>cm3</td></tr> <tr><td>Vol of weak acid req for complete neutralisation</td><td><input type='input'class='box' size="10" id='avol' value="25.00" disabled /></td><td>cm3</td></tr> <tr><td>Choice of indicator</td><td colspan=2><select id='indtype' class='inputbg box' onchange='change Chart Color(this.value)'> <option value='0'>no indicator</option> <option value='1'>methyl orange</option> <option value='2'>screened methyl orange</option> <option value='3'>phenolphthalein</option> <option value='4'>thymolphthalein</option></select></td></tr> <tr><td>Data points in increments of</td><td><select id='inc' class='inputbg box' value="1.00"> <option value=1.00>1.00</option> <option value=0.50>0.50</option> <option value=0.05>0.05 (1 drop)</option></select></td><td>cm3</td></tr> <tr><td colspan=3></td></tr> <tr><td>Stop titration at (for auto titration only)</td><td><input type='input' onchange='update Neutralisation()' class='inputbg box' size="10" id='stopt' value="50.00" /><br /><div id="stop TSlider"></td><td>cm3</td></tr> <tr><td colspan=3></td></tr> <tr> <td><input type='button' class='button greenbg' value="Do Titration Stepwise" onclick='titrate Step(); draw Chart()'></input></td> <td><input type='button' class='button redbg' value="Auto Titration" onclick='auto Titrate(); draw Chart()'></input></td> <td><input type='button' class='button' value="Reset" onclick='reset Titrate();'></input></td> </tr> </table></td> <td align=center><div id="chart_div"></div> <p class='titlebg'>Selected Point</p> Burette Volume <input type='input' class='box' size="6" id='p X' value="0.00" disabled /> p H <input type='input' class='box' size="6" id='p Y' value="0.00" disabled /><br> Select the major species present in the conical flask<br> <input type="checkbox" id="SB" value="0"> SB <input type="checkbox" id="BS" value="0"> conj base of WA <input type="checkbox" id="WA" value="0"> xs WA <input type="submit" value="Check" onclick='check Boxes()'><br> Is solution a buffer? <input type="checkbox" id="buffer" value="0"> yes <input type="submit" value="Check" onclick='check Buffer()'> </b> </td> <td> <div style='overflow:scroll; width: 200px; height:550px'> <table id="titable"> <thead><th>Burette Vol</th><th>p H</th><th>Tot Vol</th></thead> <tbody></tbody> </tabl <html> <style type='text/css'> p {font-family: "Lucida Sans Unicode", "Lucida Grande", sans-serif; margin-top: 20px; margin-left:20px;} #main Table { width: 100%; font-family: "Lucida Sans Unicode", "Lucida Grande", sans-serif} #main Table td { vertical-align:top; font-size: 10pt; } .button { font-family: "Lucida Sans Unicode", "Lucida Grande", sans-serif; font-size: 120%; padding: 10px; width: 100% } .box { font-family: "Lucida Sans Unicode", "Lucida Grande", sans-serif; font-size: 100%; padding: 2px; } #titable th { padding: 5px; margin: 5px;} #titable td { text-align : center } .greenbg { background-color:66FF66 } .redbg { background-color:pink } .inputbg { background-color:FFFF00 } .titlebg { background-color:ccddff; font-weight: bold; line-height: 200%; text-align : center; padding: 5px; margin: 5px; width: 500px} #fx stop:nth-child(1){ stop-color: white; } #fx stop:nth-child(2){ stop-color: white; } #fx stop:nth-child(3){ stop-color: white; } ul {list-style-type: none;margin: 0;padding: 0;overflow: hidden;background-color: ccddff;} li {font-family: "Lucida Sans Unicode", "Lucida Grande", sans-serif; font-size: 80%; float: left;} li a, .dropbtn { display: inline-block; color: black; font-weight: bold; text-align: center; padding: 14px 16px; text-decoration: none; } li a:hover, .dropdown:hover .dropbtn {background-color: 99b3ff;} .hover_img a { position:relative;} .hover_img a span { position:absolute; display:none; z-index:99; background-color: ffffff; left:50%; -webkit-transform: translate X(-50%); -ms-transform: translate X(-50%); transform: translate X(-50%);} .hover_img a:hover span { display:block; } </style> <link rel="stylesheet" href="https://code.jquery.com/ui/1.11.4/themes/smoothness/jquery-ui.css"> <script src="https://ajax.googleapis.com/ajax/libs/jquery/2.2.2/jquery.min.js"></script> <script src="https://code.jquery.com/ui/1.11.4/jquery-ui.js"></script> <script src="https://rawgit.com/jmosbech/Sticky Table Headers/master/js/jquery.stickytableheaders.min.js"></script> <script type="text/javascript" src="https://www.gstatic.com/charts/loader.js"></script> <script type="text/javascript"> google.charts.load('current', {'packages':['corechart']}); // Load the Visualization API and the corechart package. google.charts.set On Load Callback(first Load); // Set a callback to run when the Google Visualization API is loaded. var burette Vol = 0; var init Mol = -1; var tot Vol = 0; function create SVG(n,a,b){ var xmlns = "http://www.w3.org/2000/svg"; var e = document.create Element NS (xmlns, n); for(var k in a){ e.set Attribute NS (null, k,a[k]); } for(var k in b){ e.set Attribute (k,b[k]); } return e; }; function first Load() { $(document).ready( function() { $("#titable tbody").html( $("#titable tbody").html() + "<tr><td>" + burette Vol.to Fixed(2) + "</td><td>" + calculate PH().to Fixed(2) + "</td><td>" + tot Vol.to Fixed(2) + "</td></tr>"); update Neutralisation(); $('#titable').sticky Table Headers({ scrollable Area: $('#titable').parent() , fixed Offset:-30 }); $( "#acid Slider" ).slider({ value:100, min: 5, max: 200, step: 5, slide: function( event, ui ) { set Float("aconc", ui.value / 100); }, stop: function( event, ui ) { update Neutralisation(); } }); $( "#base Slider" ).slider({ value:100, min: 5, max: 200, step: 5, slide: function( event, ui ) { set Float("bconc", ui.value / 100); }, stop: function( event, ui ) { update Neutralisation(); } }); $( "#stop TSlider" ).slider({ value:500, min: 10, max: 500, step: 10, slide: function( event, ui ) { set Float("stopt", ui.value / 10); } }); page Loaded = true; }); } function draw Chart() { // Create the data table. var data = new google.visualization.Data Table(); data.add Column('number', 'Volume'); data.add Column('number', 'p H'); var rows = $("#titable tbody tr"); for (i = 0; i < rows.length; i++) data.add Row([ parse Float($( rows[i] ).children()[0].inner HTML), parse Float( $( rows[i] ).children()[1].inner HTML ) ]); // Set chart options var options = { h Axis: { title: 'Volume of strong base added / cm3', title Text Style: {color: '#FF0000', bold: 1, italic: 0, font Size: 20, font Name: 'Lucida Sans Unicode' }, view Window: { min: 0, max: 50 }, ticks: [0, 5, 10, 15, 20, 25, 30, 35, 40, 45, 50]}, v Axis: { title: 'p H', title Text Style: {color: '#FF0000', bold: 1, italic: 0, font Size: 20, font Name: 'Lucida Sans Unicode' }, view Window: { min: 0, max: 14 }, ticks: [0,1,2,3,4,5,6,7,8,9,10,11,12,13,14] }, 'chart Area': { top: 20 }, 'legend': {position: 'none'}, 'width':700, 'height':450, line Width: 3, colors: ['black'] }; // Instantiate and draw our chart, passing in some options. var chart = new google.visualization.Line Chart(document.get Element By Id('chart_div')); google.visualization.events.add Listener(chart, 'ready', function() { var gradient = create SVG('linear Gradient', {x1:0,y1:0, x2:0, y1:1}, {id:'fx'}); document.get Element By Id("chart_div").query Selector('svg>defs').append Child(gradient); gradient.append Child(create SVG('stop',{offset:'0%'})); gradient.append Child(create SVG('stop',{offset:'25%'})); gradient.append Child(create SVG('stop',{offset:'50%'})); gradient.append Child(create SVG('stop',{offset:'100%'})); $("svg").find("[clip-path]").parent().find("rect").first().attr("fill", "url(#fx)").attr("fill-opacity", "1"); change Chart Color($("#indtype").val()); }); function select Handler() { var selected Item = chart.get Selection()[0]; if (selected Item) { var p X = data.get Value(selected Item.row, 0).to Fixed(2); var p Y = data.get Value(selected Item.row, 1).to Fixed(2); $("#p X").val(p X); $("#p Y").val(p Y); } } google.visualization.events.add Listener(chart, 'select', select Handler); chart.draw(data, options) } function get Float(id) { return parse Float( $("#"+id).val() ); } function set Float(id, v) { $("#"+id).val( parse Float(v).to Fixed(2) ) ; } function calculatep Ka() { var x = (- Math.log10(get Float("Ka"))).to Fixed(2); $("#p Ka").val(x); if(get Float("p Ka")<2 || get Float("p Ka")>10) {alert("check Ka value, use scientific notation");} } function p HWA() { return -Math.log10(Math.sqrt( get Float("Ka") * get Float("aconc") )); } function p HAB(conc A, conc S) { return -Math.log10(get Float("Ka")) + Math.log10(conc S/conc A); } function p HWB(conc) { return 14+Math.log10(Math.sqrt(1e-14/get Float("Ka")*conc)); } function p HSB(conc) { return 14 + Math.log10(conc) } function calculate PH() { if ( burette Vol.to Fixed(2) == 0 ) { return p HWA(); } else if (burette Vol.to Fixed(2) == get Float("bvol").to Fixed(2) ) { return p HWB(init Mol/tot Vol); } else if (burette Vol < get Float("bvol") ) { return p HAB( parse Float( init Mol - burette Vol * get Float("bconc") * get Float("btype") ), parse Float(burette Vol * get Float("bconc") * get Float("btype")) ); } else if (burette Vol > get Float("bvol") ) { return p HSB( ( burette Vol * get Float("bconc") * get Float("btype") - init Mol ) / (tot Vol) ); } } function init Vars() { init Mol = get Float("aconc") * get Float("avol"); tot Vol = get Float("avol"); burette Vol = 0; } function titrate Step() { if (init Mol == -1) init Vars(); burette Vol += get Float("inc"); tot Vol += get Float("inc"); $("#titable tbody").html( $("#titable tbody").html() + "<tr><td>" + burette Vol.to Fixed(2) + "</td><td>" + calculate PH().to Fixed(2) + "</td><td>" + tot Vol.to Fixed(2) + "</td></tr>"); } function update Neutralisation() { set Float("bvol", (( get Float("avol") * get Float("aconc") ) / ( get Float("btype") * get Float("bconc")))); if (get Float("bvol") > 50) {alert("Titre volume cannot exceed maximum capacity of burette!");} else if (get Float("bvol") < 15) {alert("Titre volume too small, leads to large percentage error!");} reset Titrate(); } function auto Titrate() { while ( burette Vol < get Float("stopt")) { titrate Step(); } } function reset Titrate() { $("#titable tbody").html( "" ) draw Chart(); init Vars(); $("#titable tbody").html( $("#titable tbody").html() + "<tr><td>" + burette Vol.to Fixed(2) + "</td><td>" + calculate PH().to Fixed(2) + "</td><td>" + tot Vol.to Fixed(2) + "</td></tr>"); } var chart Col = {'0': ["white", "white", "white", "white"], '1': ["red", "orange", "#ffff33", "#ffff33"], '2': ["#990099", "grey", "#009933", "#009933"], '3': ["white", "white", "white","fuchsia"], '4': ["white", "white", "white","#2c5ba5"], }; function change Chart Color(ind Type) { $("#fx stop:nth-child(1)").css("stop-color",chart Col[ind Type][0]) $("#fx stop:nth-child(2)").css("stop-color",chart Col[ind Type][1]) $("#fx stop:nth-child(3)").css("stop-color",chart Col[ind Type][2]) $("#fx stop:nth-child(4)").css("stop-color",chart Col[ind Type][3]) } function check Boxes() { if (get Float("p X") == 0 && $("#WA").prop('checked')==true && $("#BS").prop('checked')==false && $("#SB").prop('checked')==false) {alert("Good job!");} else if (get Float("p X") < get Float("bvol") && get Float("p X") > 0 && $("#WA").prop('checked')==true && $("#BS").prop('checked')==true && $("#SB").prop('checked')==false) {alert("Good job!");} else if (get Float("p X") > get Float("bvol") && $("#WA").prop('checked')==false && $("#BS").prop('checked')==true && $("#SB").prop('checked')==true) {alert("Good job!");} else if (get Float("p X") == get Float("bvol") && $("#WA").prop('checked')==false && $("#BS").prop('checked')==true && $("#SB").prop('checked')==false) {alert("Good job!");} else {alert("Please try again.");} } function check Buffer() { if ( get Float("p Y") > (get Float("p Ka")-1) && get Float("p Y") < (get Float("p Ka")+1) ) { if($("#buffer").prop('checked')==true) {alert("Good job!");} else {alert("Please try again. What are the 2 components required in large excess to form a buffer?");} } if (get Float("p Y") < (get Float("p Ka")-1) || get Float("p Y") > (get Float("p Ka")+1)) { if($("#buffer").prop('checked')==false) {alert("Good job!");} else {alert("Please try again. What are the 2 components required in large excess to form a buffer?");} } } </script> <body> <ul> <li><a class="active" a href="index.html">Introduction</a></li> <li><a href="SASB.html">Strong Acid - Strong Base</a></li> <li><a href="SBSA.html">Strong Base - Strong Acid</a></li> <li><a href="WASB.html">Weak Acid - Strong Base</a></li> <li><a href="WBSA.html">Weak Base - Strong Acid</a></li> <li><a href="SBWA.html">Strong Base - Weak Acid</a></li> <li><a href="SAWB.html">Strong Acid - Weak Base</a></li> </ul> <div class="hover_img"> <p style="font-size:20px"><b>Titration Curve of Weak Acid against Strong Base</b> <a href="#">(image)<span><img src="WASB.png" height=500 border=2 ></span></a></p> </div> <table id='main Table' border=0 cellspacing=5 cellpadding=5> <tr><td><table cellpadding=5 width="20%"> <tr><td colspan=3 class='titlebg'>Set Titration Parameters</td></tr> <tr><td width="10%">[acid] = </td><td><input type='input' onchange='update Neutralisation()' class='inputbg box' size="10" id='aconc' value="1.00" /><br /><div id="acid Slider"></td><td>mol dm-3</td></tr> <tr><td>Ka (scientific notation) = </td><td><input type='input'class='inputbg box' size="10" id='Ka' value="1.80e-5" onchange='calculatep Ka(); update Neutralisation()' /></td><td>mol dm-3</td></tr> <tr><td>p Ka = </td><td><input type='input' class='box'size="10" id='p Ka' value="4.74" disabled /></td></tr> <tr><td>[base] = </td><td><input type='input' onchange='update Neutralisation()' class='inputbg box'size="10" id='bconc' value="1.00"/><br /><div id="base Slider"></td><td>mol dm-3</td></tr> <tr><td>Strong base is</td><td colspan=2><select id='btype' class='inputbg box' onchange='update Neutralisation()'> <option value=1>monoprotic</option> <option value=2>diprotic</option></select></td></tr> <tr><td>Vol of weak acid in conical flask</td><td><select id='avol' class='inputbg box' onchange="update Neutralisation();"> <option value=25>25.0</option> <option value=10>10.0</option></select></td><td>cm3</td></tr> <tr><td>Vol of strong base req for complete neutralisation</td><td><input type='input'class='box' size="10" id='bvol' value="25.00" disabled /></td><td>cm3</td></tr> <tr><td>Choice of indicator</td><td colspan=2><select id='indtype' class='inputbg box' onchange='change Chart Color(this.value)'> <option value='0'>no indicator</option> <option value='1'>methyl orange</option> <option value='2'>screened methyl orange</option> <option value='3'>phenolphthalein</option> <option value='4'>thymolphthalein</option></select></td></tr> <tr><td>Data points in increments of</td><td><select id='inc' class='inputbg box' value="1.00"> <option value=1.00>1.00</option> <option value=0.50>0.50</option> <option value=0.05>0.05 (1 drop)</option></select></td><td>cm3</td></tr> <tr><td colspan=3></td></tr> <tr><td>Stop titration at (for auto titration only)</td><td><input type='input' onchange='update Neutralisation()' class='inputbg box' size="10" id='stopt' value="50.00" /><br /><div id="stop TSlider"></td><td>cm3</td></tr> <tr><td colspan=3></td></tr> <tr> <td><input type='button' class='button greenbg' value="Do Titration Stepwise" onclick='titrate Step(); draw Chart()'></input></td> <td><input type='button' class='button redbg' value="Auto Titration" onclick='auto Titrate(); draw Chart()'></input></td> <td><input type='button' class='button' value="Reset" onclick='reset Titrate();'></input></td> </tr> </table></td> <td align=center><div id="chart_div"></div> <p class='titlebg'>Selected Point</p> Burette Volume <input type='input' class='box' size="6" id='p X' value="0.00" disabled /> p H <input type='input' class='box' size="6" id='p Y' value="0.00" disabled /><br> Select the major species present in the conical flask<br> <input type="checkbox" id="WA" value="0"> WA <input type="checkbox" id="BS" value="0"> conj base of WA <input type="checkbox" id="SB" value="0"> xs SB <input type="submit" value="Check" onclick='check Boxes()'><br> Is solution a buffer? <input type="checkbox" id="buffer" value="0"> yes <input type="submit" value="Check" onclick='check Buffer()'> </b> </td> <td> <div style='overflow:scroll; width: 200px; height:550px'> <table id="titable"> <thead><th>Burette Vol</th><th>p H</th><th>Tot Vol</th></thead> <tbody></tbody> </table> </div> </td> </tr> <html> <style type='text/css'> p {font-family: "Lucida Sans Unicode", "Lucida Grande", sans-serif; margin-top: 20px; margin-left:20px;} #main Table { width: 100%; font-family: "Lucida Sans Unicode", "Lucida Grande", sans-serif} #main Table td { vertical-align:top; font-size: 10pt; } .button { font-family: "Lucida Sans Unicode", "Lucida Grande", sans-serif; font-size: 120%; padding: 10px; width: 100% } .box { font-family: "Lucida Sans Unicode", "Lucida Grande", sans-serif; font-size: 100%; padding: 2px; } #titable th { padding: 5px; margin: 5px;} #titable td { text-align : center } .greenbg { background-color:66FF66 } .redbg { background-color:pink } .inputbg { background-color:FFFF00 } .titlebg { background-color:ccddff; font-weight: bold; line-height: 200%; text-align : center; padding: 5px; margin: 5px; width: 500px} #fx stop:nth-child(1){ stop-color: white; } #fx stop:nth-child(2){ stop-color: white; } #fx stop:nth-child(3){ stop-color: white; } ul {list-style-type: none;margin: 0;padding: 0;overflow: hidden;background-color: ccddff;} li {font-family: "Lucida Sans Unicode", "Lucida Grande", sans-serif; font-size: 80%; float: left;} li a, .dropbtn { display: inline-block; color: black; font-weight: bold; text-align: center; padding: 14px 16px; text-decoration: none; } li a:hover, .dropdown:hover .dropbtn {background-color: 99b3ff;} .hover_img a { position:relative;} .hover_img a span { position:absolute; display:none; z-index:99; background-color: ffffff; left:50%; -webkit-transform: translate X(-50%); -ms-transform: translate X(-50%); transform: translate X(-50%);} .hover_img a:hover span { display:block; } </style> <link rel="stylesheet" href="https://code.jquery.com/ui/1.11.4/themes/smoothness/jquery-ui.css"> <script src="https://ajax.googleapis.com/ajax/libs/jquery/2.2.2/jquery.min.js"></script> <script src="https://code.jquery.com/ui/1.11.4/jquery-ui.js"></script> <script src="https://rawgit.com/jmosbech/Sticky Table Headers/master/js/jquery.stickytableheaders.min.js"></script> <script type="text/javascript" src="https://www.gstatic.com/charts/loader.js"></script> <script type="text/javascript"> google.charts.load('current', {'packages':['corechart']}); // Load the Visualization API and the corechart package. google.charts.set On Load Callback(first Load); // Set a callback to run when the Google Visualization API is loaded. var burette Vol = 0; var init Mol = -1; var tot Vol = 0; function create SVG(n,a,b){ var xmlns = "http://www.w3.org/2000/svg"; var e = document.create Element NS (xmlns, n); for(var k in a){ e.set Attribute NS (null, k,a[k]); } for(var k in b){ e.set Attribute (k,b[k]); } return e; }; function first Load() { $(document).ready( function() { $("#titable tbody").html( $("#titable tbody").html() + "<tr><td>" + burette Vol.to Fixed(2) + "</td><td>" + calculate PH().to Fixed(2) + "</td><td>" + tot Vol.to Fixed(2) + "</td></tr>"); update Neutralisation(); $('#titable').sticky Table Headers({ scrollable Area: $('#titable').parent() , fixed Offset:-30 }); $( "#acid Slider" ).slider({ value:100, min: 5, max: 200, step: 5, slide: function( event, ui ) { set Float("aconc", ui.value / 100); }, stop: function( event, ui ) { update Neutralisation(); } }); $( "#base Slider" ).slider({ value:100, min: 5, max: 200, step: 5, slide: function( event, ui ) { set Float("bconc", ui.value / 100); }, stop: function( event, ui ) { update Neutralisation(); } }); $( "#stop TSlider" ).slider({ value:500, min: 10, max: 500, step: 10, slide: function( event, ui ) { set Float("stopt", ui.value / 10); } }); page Loaded = true; }); } function draw Chart() { // Create the data table. var data = new google.visualization.Data Table(); data.add Column('number', 'Volume'); data.add Column('number', 'p H'); var rows = $("#titable tbody tr"); for (i = 0; i < rows.length; i++) data.add Row([ parse Float($( rows[i] ).children()[0].inner HTML), parse Float( $( rows[i] ).children()[1].inner HTML ) ]); // Set chart options var options = { h Axis: { title: 'Volume of strong acid added / cm3', title Text Style: {color: '#FF0000', bold: 1, italic: 0, font Size: 20, font Name: 'Lucida Sans Unicode' }, view Window: { min: 0, max: 50 }, ticks: [0, 5, 10, 15, 20, 25, 30, 35, 40, 45, 50]}, v Axis: { title: 'p H', title Text Style: {color: '#FF0000', bold: 1, italic: 0, font Size: 20, font Name: 'Lucida Sans Unicode' }, view Window: { min: 0, max: 14 }, ticks: [0,1,2,3,4,5,6,7,8,9,10,11,12,13,14] }, 'chart Area': { top: 20 }, 'legend': {position: 'none'}, 'width':700, 'height':450, line Width: 3, colors: ['black'] }; // Instantiate and draw our chart, passing in some options. var chart = new google.visualization.Line Chart(document.get Element By Id('chart_div')); google.visualization.events.add Listener(chart, 'ready', function() { var gradient = create SVG('linear Gradient', {x1:0,y1:0, x2:0, y1:1}, {id:'fx'}); document.get Element By Id("chart_div").query Selector('svg>defs').append Child(gradient); gradient.append Child(create SVG('stop',{offset:'0%'})); gradient.append Child(create SVG('stop',{offset:'25%'})); gradient.append Child(create SVG('stop',{offset:'50%'})); gradient.append Child(create SVG('stop',{offset:'100%'})); $("svg").find("[clip-path]").parent().find("rect").first().attr("fill", "url(#fx)").attr("fill-opacity", "1"); change Chart Color($("#indtype").val()); }); function select Handler() { var selected Item = chart.get Selection()[0]; if (selected Item) { var p X = data.get Value(selected Item.row, 0).to Fixed(2); var p Y = data.get Value(selected Item.row, 1).to Fixed(2); $("#p X").val(p X); $("#p Y").val(p Y); } } google.visualization.events.add Listener(chart, 'select', select Handler); chart.draw(data, options) } function get Float(id) { return parse Float( $("#"+id).val() ); } function set Float(id, v) { $("#"+id).val( parse Float(v).to Fixed(2) ) ; } function calculatep Kb() { var x = (-Math.log10(get Float("Kb"))).to Fixed(2); $("#p Kb").val(x); if(get Float("p Kb")<2 || get Float("p Kb")>10) {alert("check Kb value, use scientific notation");} } function p HWB() { return 14 + Math.log10(Math.sqrt( get Float("Kb") * get Float("bconc") )); } function p HBB(conc B, conc S) { return 14 - (-Math.log10(get Float("Kb")) + (Math.log10(conc S/conc B))); } function p HWA(conc) { return -Math.log10(Math.sqrt(1e-14/get Float("Kb")*conc)); } function p HSA(conc) { return -Math.log10(conc) } function calculate PH() { if ( burette Vol.to Fixed(2) == 0 ) { return p HWB(); } else if (burette Vol.to Fixed(2) == get Float("avol").to Fixed(2) ) { return p HWA(init Mol/tot Vol); } else if (burette Vol < get Float("avol") ) { return p HBB( ( init Mol - burette Vol * get Float("aconc") * get Float("atype") ), (burette Vol * get Float("aconc") * get Float("atype")) ); } else if (burette Vol > get Float("avol") ) { return p HSA( ( burette Vol * get Float("aconc") * get Float("atype") - init Mol ) / (tot Vol) ); } } function init Vars() { init Mol = get Float("bconc") * get Float("bvol"); tot Vol = get Float("bvol"); burette Vol = 0; } function titrate Step() { if (init Mol == -1) init Vars(); burette Vol += get Float("inc"); tot Vol += get Float("inc"); $("#titable tbody").html( $("#titable tbody").html() + "<tr><td>" + burette Vol.to Fixed(2) + "</td><td>" + calculate PH().to Fixed(2) + "</td><td>" + tot Vol.to Fixed(2) + "</td></tr>"); $("#titable").parent().scroll Top( $("#titable").height() ) } function update Neutralisation() { $("#avol").val( ( ( get Float("bvol") * get Float("bconc") ) / ( get Float("atype") * get Float("aconc") ) ).to Fixed(2) ); if (get Float("avol") > 50) {alert("Titre volume cannot exceed maximum capacity of burette!");} else if (get Float("avol") < 15) {alert("Titre volume too small, leads to large percentage error!");} reset Titrate(); } function auto Titrate() { while ( burette Vol < get Float("stopt")) { titrate Step(); } } function reset Titrate() { $("#titable tbody").html( "" ) draw Chart(); init Vars(); $("#titable tbody").html( $("#titable tbody").html() + "<tr><td>" + burette Vol.to Fixed(2) + "</td><td>" + calculate PH().to Fixed(2) + "</td><td>" + tot Vol.to Fixed(2) + "</td></tr>"); } var chart Col = {'0': ["white", "white", "white", "white"], '1': ["red", "orange", "#ffff33", "#ffff33"], '2': ["#990099", "grey", "#009933", "#009933"], '3': ["white", "white", "white","fuchsia"], '4': ["white", "white", "white","#2c5ba5"], }; function change Chart Color(ind Type) { $("#fx stop:nth-child(1)").css("stop-color",chart Col[ind Type][0]) $("#fx stop:nth-child(2)").css("stop-color",chart Col[ind Type][1]) $("#fx stop:nth-child(3)").css("stop-color",chart Col[ind Type][2]) $("#fx stop:nth-child(4)").css("stop-color",chart Col[ind Type][3]) } function check Boxes() { if (get Float("p X") == 0 && $("#WB").prop('checked')==true && $("#AS").prop('checked')==false && $("#SA").prop('checked')==false) {alert("Good job!");} else if (get Float("p X") < get Float("avol") && get Float("p X") > 0 && $("#WB").prop('checked')==true && $("#AS").prop('checked')==true && $("#SA").prop('checked')==false) {alert("Good job!");} else if (get Float("p X") > get Float("avol") && $("#WB").prop('checked')==false && $("#AS").prop('checked')==true && $("#SA").prop('checked')==true) {alert("Good job!");} else if (get Float("p X") == get Float("avol") && $("#WB").prop('checked')==false && $("#AS").prop('checked')==true && $("#SA").prop('checked')==false) {alert("Good job!");} else {alert("Please try again.");} } function check Buffer() { if ( (14-get Float("p Y")) > (get Float("p Kb")-1) && (14-get Float("p Y")) < (get Float("p Kb")+1) ) { if($("#buffer").prop('checked')==true) {alert("Good job!");} else {alert("Please try again. What are the 2 components required in large excess to form a buffer?");} } else if ( (14-get Float("p Y")) < (get Float("p Kb")-1) || (14-get Float("p Y")) > (get Float("p Kb")+1) ) { if($("#buffer").prop('checked')==false) {alert("Good job!");} else {alert("Please try again. What are the 2 components required in large excess to form a buffer?");} } } </script> <body> <ul> <li><a class="active" a href="index.html">Introduction</a></li> <li><a href="SASB.html">Strong Acid - Strong Base</a></li> <li><a href="SBSA.html">Strong Base - Strong Acid</a></li> <li><a href="WASB.html">Weak Acid - Strong Base</a></li> <li><a href="WBSA.html">Weak Base - Strong Acid</a></li> <li><a href="SBWA.html">Strong Base - Weak Acid</a></li> <li><a href="SAWB.html">Strong Acid - Weak Base</a></li> </ul> <div class="hover_img"> <p style="font-size:20px"><b>Titration Curve of Weak Base against Strong Acid</b> <a href="#">(image)<span><img src="WBSA.png" height=500 border=2 ></span></a></p> </div> <table id='main Table' border=0 cellspacing=5 cellpadding=5> <tr><td><table cellpadding=5 width="20%"> <tr><td colspan=3 class='titlebg'>Set Titration Parameters</td></tr> <tr><td width="10%">[base] = </td><td><input type='input' onchange='update Neutralisation()' class='inputbg box' size="10" id='bconc' value="1.00" /><br /><div id="base Slider"></td><td>mol dm-3</td></tr> <tr><td>Kb (scientific notation) = </td><td><input type='input'class='inputbg box' size="10" id='Kb' value="1.80e-5" onchange='calculatep Kb(); update Neutralisation()' /></td><td>mol dm-3</td></tr> <tr><td>p Kb = </td><td><input type='input' class='box'size="10" id='p Kb' value="4.74" disabled /></td></tr> <tr><td>[acid] = </td><td><input type='input' onchange='update Neutralisation()' class='inputbg box'size="10" id='aconc' value="1.00"/><br /><div id="acid Slider"></td><td>mol dm-3</td></tr> <tr><td>Strong acid is</td><td colspan=2><select id='atype' class='inputbg box' onchange='update Neutralisation()'> <option value=1>monoprotic</option> <option value=2>diprotic</option></select></td></tr> <tr><td>Vol of weak base in conical flask</td><td><select id='bvol' class='inputbg box' onchange="update Neutralisation();"> <option value=25>25.0</option> <option value=10>10.0</option></select></td><td>cm3</td></tr> <tr><td>Vol of strong acid req for complete neutralisation</td><td><input type='input'class='box' size="10" id='avol' value="25.00" disabled /></td><td>cm3</td></tr> <tr><td>Choice of indicator</td><td colspan=2><select id='indtype' class='inputbg box' onchange='change Chart Color(this.value)'> <option value='0'>no indicator</option> <option value='1'>methyl orange</option> <option value='2'>screened methyl orange</option> <option value='3'>phenolphthalein</option> <option value='4'>thymolphthalein</option></select></td></tr> <tr><td>Data points in increments of</td><td><select id='inc' class='inputbg box' value="1.00"> <option value=1.00>1.00</option> <option value=0.50>0.50</option> <option value=0.05>0.05 (1 drop)</option></select></td><td>cm3</td></tr> <tr><td colspan=3></td></tr> <tr><td>Stop titration at (for auto titration only)</td><td><input type='input' onchange='update Neutralisation()' class='inputbg box' size="10" id='stopt' value="50.00" /><br /><div id="stop TSlider"></td><td>cm3</td></tr> <tr><td colspan=3></td></tr> <tr> <td><input type='button' class='button greenbg' value="Do Titration Stepwise" onclick='titrate Step(); draw Chart()'></input></td> <td><input type='button' class='button redbg' value="Auto Titration" onclick='auto Titrate(); draw Chart()'></input></td> <td><input type='button' class='button' value="Reset" onclick='reset Titrate();'></input></td> </tr> </table></td> <td align=center><div id="chart_div"></div> <p class='titlebg'>Selected Point</p> Burette Volume <input type='input' class='box' size="6" id='p X' value="0.00" disabled /> p H <input type='input' class='box' size="6" id='p Y' value="0.00" disabled /><br> Select the major species present in the conical flask<br> <input type="checkbox" id="WB" value="0"> WB <input type="checkbox" id="AS" value="0"> conj acid of WB <input type="checkbox" id="SA" value="0"> xs SA <input type="submit" value="Check" onclick='check Boxes()'><br> Is solution a buffer? <input type="checkbox" id="buffer" value="0"> yes <input type="submit" value="Check" onclick='check Buffer()'> </b> </td> <td> <div style='overflow:scroll; width: 200px; height:550px'> <table id="titable"> <thead><th>Burette Vol</th><th>p H</th><th>To.

What Students Can Learn

  • Identify the main controls and the visible output.
  • Change one setting at a time.
  • Compare two cases using evidence from the screen.
  • State the concept or rule shown by the model.

Guiding Question

What relationship does the model help you see more clearly?

3. Try the Investigation

Predict

Choose one control and predict what will happen before changing it.

Observe

Change one setting and describe exactly what changes on screen.

Compare

Test a second setting and compare the two outcomes.

Explain

Use the evidence from the model to explain the concept or rule being illustrated.

4. Teacher Notes

Lesson Use

Use the simulation as a short inquiry activity: predict first, change one control, observe the result, then explain the relationship shown by the model.

Discussion Prompts

Ask learners what changed, what stayed constant, what evidence they used, and how the model helps them explain the concept more clearly.

5. Concept Check

These questions are generated from the topic and the concept illustrated by the simulation. Use them after students have explored the model.

Concept Score

Correct first attempts build a streak and unlock higher point multipliers on this device.

0page points
0current streak
x1multiplier
0best streak
Answer each question once to build your streak.

1. What should learners do first when using Volume of strong base added / cm3', title Text Style: {color: '#FF0000', bold: 1, italic: 0, font Size: 20, font Name: 'Lucida Sans Unicode' }, view Window: { min: 0, max: 50 }, ticks: [0, 5, 10, 15, 20, 25, 30, 35, 40, 45, 50]}, v Axis: { title: 'p H', title Text Style: {color: '#FF0000', bold: 1, italic: 0, font Size: 20, font Name: 'Lucida Sans Unicode' }, view Window: { min: 0, max: 14 }, ticks: [0,1,2,3,4,5,6,7,8,9,10,11,12,13,14] }, 'chart Area': { top: 20 }, 'legend': {position: 'none'}, 'tooltip': {is Html: true}, // This MUST be set to true for your chart to show. 'width':700, 'height':450, line Width: 3, colors: ['black'] }; // Instantiate and draw our chart, passing in some options. var chart = new google.visualization.Line Chart(document.get Element By Id('chart_div')); google.visualization.events.add Listener(chart, 'ready', function() { var gradient = create SVG('linear Gradient', {x1:0,y1:0, x2:0, y1:1}, {id:'fx'}); document.get Element By Id("chart_div").query Selector('svg>defs').append Child(gradient); gradient.append Child(create SVG('stop',{offset:'0%'})); gradient.append Child(create SVG('stop',{offset:'25%'})); gradient.append Child(create SVG('stop',{offset:'50%'})); gradient.append Child(create SVG('stop',{offset:'100%'})); $("svg").find("[clip-path]").parent().find("rect").first().attr("fill", "url(#fx)").attr("fill-opacity", "1"); change Chart Color($("#indtype").val()); }); function select Handler() { var selected Item = chart.get Selection()[0]; if (selected Item) { var p X = data.get Value(selected Item.row, 0).to Fixed(2); var p Y = data.get Value(selected Item.row, 1).to Fixed(2); $("#p X").val(p X); $("#p Y").val(p Y); } } google.visualization.events.add Listener(chart, 'select', select Handler); chart.draw(data, options) } function get Float(id) { return parse Float( $("#"+id).val() ); } function set Float(id, v) { $("#"+id).val( parse Float(v).to Fixed(2) ) ; } function p HSA(conc) { return -Math.log10(conc); } function p HSB(conc) { return 14 + Math.log10(conc) } function calculate PH() { if (burette Vol.to Fixed(2) == get Float("bvol").to Fixed(2) ) { return 7.0; } else if (burette Vol < get Float("bvol") ) { return p HSA( ( init Mol - burette Vol * get Float("bconc") * get Float("btype") ) / (tot Vol) ); } else if (burette Vol > get Float("bvol") ) { return p HSB( ( (burette Vol*get Float("bconc")*get Float("btype")-init Mol) ) / (tot Vol) ); } } function init Vars() { init Mol = get Float("aconc") * get Float("avol") * get Float("atype"); tot Vol = get Float("avol"); burette Vol = 0; tooltip Charts HTML = {}; generate Graph For Current Burette Volume(); } function generate Graph For Current Burette Volume() { var tot Acid Mol = get Float("aconc") * get Float("avol") * get Float("atype") / 1000; var acid Mol = tot Acid Mol - burette Vol * get Float("bconc") * get Float("btype") / 1000; var salt Mol = burette Vol * get Float("bconc") * get Float("btype") / 1000; if (salt Mol > tot Acid Mol) salt Mol = tot Acid Mol; var data = new google.visualization.Data Table(); data.add Column('string', 'Species Type'); data.add Column('number', 'Mols'); data.add Rows([ ["strong acid", acid Mol > 0 ? acid Mol : 0], ["salt", salt Mol], ["xs strong base", acid Mol < 0 ? -acid Mol : 0] ]); var hidden Div = document.get Element By Id('hidden_div'); var tooltip Chart = new google.visualization.Column Chart(hidden Div); var cur Burette Vol = burette Vol.to Fixed(2); // As the following function is a callback, it means that by the time it is called burette Vol may have changed. So we fixed it in a variable now google.visualization.events.add Listener(tooltip Chart, 'ready', function() { // Get the PNG of the chart and set it as the src of an img tag, to be displayed as HTML tooltip Charts HTML[cur Burette Vol] = '<img src="' + tooltip Chart.get Image URI() + '">';; }); var tooltip Options = { title: 'Amount of each species present', v Axis: { title: 'Amount / mol', title Text Style: {color: 'black', bold: 1, italic: 0, font Size: 10, font Name: 'Lucida Sans Unicode' }, view Window: { min: 0, max: get Float("aconc") * get Float("avol") * get Float("atype") / 1000 }, }, legend: {position: 'none'}, axes: { y: { 0: {label: "Amount / mol"} } } }; tooltip Chart.draw(data, tooltip Options); } function titrate Step() { if (page Loaded == false) { alert("Please wait for a while, page scripts still loading."); return; } if (init Mol == -1) init Vars(); burette Vol += get Float("inc"); tot Vol += get Float("inc"); generate Graph For Current Burette Volume( ); $("#titable tbody").html( $("#titable tbody").html() + "<tr><td>" + burette Vol.to Fixed(2) + "</td><td>" + calculate PH().to Fixed(2) + "</td><td>" + tot Vol.to Fixed(2) + "</td></tr>"); $("#titable").parent().scroll Top( $("#titable").height() ) } function update Neutralisation() { $("#bvol").val( ( ( get Float("avol") * get Float("atype") * get Float("aconc") ) / ( get Float("btype") * get Float("bconc") ) ).to Fixed(2) ); if (get Float("bvol") > 50) {alert("Titre volume cannot exceed maximum capacity of burette!");} else if (get Float("bvol") < 15) {alert("Titre volume too small, leads to large percentage error!");} reset Titrate(); } function auto Titrate() { if (page Loaded == false) { alert("Please wait for a while, page scripts still loading."); return; } if ( burette Vol < get Float("stopt")) { titrate Step(); window.set Timeout("auto Titrate()", 1); // Set a break before next function call, so that display worker gets a chance to update the display } else { draw Chart(); } } function reset Titrate() { $("#titable tbody").html( "" ) draw Chart(); init Vars(); $("#titable tbody").html( $("#titable tbody").html() + "<tr><td>" + burette Vol.to Fixed(2) + "</td><td>" + calculate PH().to Fixed(2) + "</td><td>" + tot Vol.to Fixed(2) + "</td></tr>"); } var chart Col = {'0': ["white", "white", "white", "white"], '1': ["red", "orange", "#ffff33", "#ffff33"], '2': ["#990099", "grey", "#009933", "#009933"], '3': ["white", "white", "white","fuchsia"], '4': ["white", "white", "white","#2c5ba5"], }; function change Chart Color(ind Type) { $("#fx stop:nth-child(1)").css("stop-color",chart Col[ind Type][0]) $("#fx stop:nth-child(2)").css("stop-color",chart Col[ind Type][1]) $("#fx stop:nth-child(3)").css("stop-color",chart Col[ind Type][2]) $("#fx stop:nth-child(4)").css("stop-color",chart Col[ind Type][3]) } function check Boxes() { if (get Float("p X") < get Float("bvol") && get Float("p X") > 0 && $("#SA").prop('checked')==true && $("#NS").prop('checked')==true && $("#SB").prop('checked')==false) {alert("Good job!");} else if (get Float("p X") > get Float("bvol") && $("#SA").prop('checked')==false && $("#NS").prop('checked')==true && $("#SB").prop('checked')==true) {alert("Good job!");} else if (get Float("p X") == get Float("bvol") && $("#SA").prop('checked')==false && $("#NS").prop('checked')==true && $("#SB").prop('checked')==false) {alert("Good job!");} else if (get Float("p X") == 0 && $("#SA").prop('checked')==true && $("#NS").prop('checked')==false && $("#SB").prop('checked')==false) {alert("Good job!");} else {alert("Please try again.");} } </script> <body> <ul> <li><a class="active" a href="index.html">Introduction</a></li> <li><a href="SASB.html">Strong Acid - Strong Base</a></li> <li><a href="SBSA.html">Strong Base - Strong Acid</a></li> <li><a href="WASB.html">Weak Acid - Strong Base</a></li> <li><a href="WBSA.html">Weak Base - Strong Acid</a></li> <li><a href="SBWA.html">Strong Base - Weak Acid</a></li> <li><a href="SAWB.html">Strong Acid - Weak Base</a></li> </ul> <div class="hover_img"> <p style="font-size:20px"><b>Titration Curve of Strong Acid against Strong Base</b> <a href="#">(image)<span><img src="SASB.png" height=500 border=2 ></span></a> </div> </p> <table id='main Table' border=0 cellspacing=5 cellpadding=5> <tr><td><table cellpadding=5 width="20%"> <tr><td colspan=3 class='titlebg'>Set Titration Parameters</td></tr> <tr><td width="10%">[acid] = </td><td><input type='input' onchange='update Neutralisation()' class='inputbg box' size="10" id='aconc' value="1.00" /><br /><div id="acid Slider"></td><td>mol dm-3</td></tr> <tr><td>Strong acid is</td><td colspan=2><select id='atype' class='inputbg box' onchange='update Neutralisation()'> <option value=1>monoprotic</option> <option value=2>diprotic</option></select></td></tr> <tr><td>[base] = </td><td><input type='input' onchange='update Neutralisation()' class='inputbg box'size="10" id='bconc' value="1.00"/><br /><div id="base Slider"></td><td>mol dm-3</td></tr> <tr><td>Strong base is</td><td colspan=2><select id='btype' class='inputbg box' onchange='update Neutralisation()'> <option value=1>monoprotic</option> <option value=2>diprotic</option></select></td></tr> <tr><td>Vol of strong acid in conical flask</td><td><select id='avol' class='inputbg box' onchange="update Neutralisation();"> <option value=25>25.0</option> <option value=10>10.0</option></select></td><td>cm3</td></tr> <tr><td>Vol of strong base req for complete neutralisation</td><td><input type='input'class='box' size="10" id='bvol' value="25.00" disabled /></td><td>cm3</td></tr> <tr><td>Choice of indicator</td><td colspan=2><select id='indtype' class='inputbg box' onchange='change Chart Color(this.value)'> <option value='0'>no indicator</option> <option value='1'>methyl orange</option> <option value='2'>screened methyl orange</option> <option value='3'>phenolphthalein</option> <option value='4'>thymolphthalein</option></select <html> <style type='text/css'> p {font-family: "Lucida Sans Unicode", "Lucida Grande", sans-serif; margin-top: 20px; margin-left:20px;} #main Table { width: 100%; font-family: "Lucida Sans Unicode", "Lucida Grande", sans-serif} #main Table td { vertical-align:top; font-size: 10pt; } .button { font-family: "Lucida Sans Unicode", "Lucida Grande", sans-serif; font-size: 120%; padding: 10px; width: 100% } .box { font-family: "Lucida Sans Unicode", "Lucida Grande", sans-serif; font-size: 100%; padding: 2px; } #titable th { padding: 5px; margin: 5px;} #titable td { text-align : center } .greenbg { background-color:66FF66 } .redbg { background-color:pink } .inputbg { background-color:FFFF00 } .titlebg { background-color:ccddff; font-weight: bold; line-height: 200%; text-align : center; padding: 5px; margin: 5px; width: 500px} #fx stop:nth-child(1){ stop-color: white; } #fx stop:nth-child(2){ stop-color: white; } #fx stop:nth-child(3){ stop-color: white; } ul {list-style-type: none;margin: 0;padding: 0;overflow: hidden;background-color: ccddff;} li {font-family: "Lucida Sans Unicode", "Lucida Grande", sans-serif; font-size: 80%; float: left;} li a, .dropbtn { display: inline-block; color: black; font-weight: bold; text-align: center; padding: 14px 16px; text-decoration: none; } li a:hover, .dropdown:hover .dropbtn {background-color: 99b3ff;} .hover_img a { position:relative;} .hover_img a span { position:absolute; display:none; z-index:99; background-color: ffffff; left:50%; -webkit-transform: translate X(-50%); -ms-transform: translate X(-50%); transform: translate X(-50%);} .hover_img a:hover span { display:block; } </style> <link rel="stylesheet" href="https://code.jquery.com/ui/1.11.4/themes/smoothness/jquery-ui.css"> <script src="https://ajax.googleapis.com/ajax/libs/jquery/2.2.2/jquery.min.js"></script> <script src="https://code.jquery.com/ui/1.11.4/jquery-ui.js"></script> <script src="https://rawgit.com/jmosbech/Sticky Table Headers/master/js/jquery.stickytableheaders.min.js"></script> <script type="text/javascript" src="https://www.gstatic.com/charts/loader.js"></script> <script type="text/javascript"> google.charts.load('current', {'packages':['corechart']}); // Load the Visualization API and the corechart package. google.charts.set On Load Callback(first Load); // Set a callback to run when the Google Visualization API is loaded. var burette Vol = 0; var init Mol = -1; var tot Vol = 0; function create SVG(n,a,b){ var xmlns = "http://www.w3.org/2000/svg"; var e = document.create Element NS (xmlns, n); for(var k in a){ e.set Attribute NS (null, k,a[k]); } for(var k in b){ e.set Attribute (k,b[k]); } return e; }; function first Load() { $(document).ready( function() { $("#titable tbody").html( $("#titable tbody").html() + "<tr><td>" + burette Vol.to Fixed(2) + "</td><td>" + calculate PH().to Fixed(2) + "</td><td>" + tot Vol.to Fixed(2) + "</td></tr>"); update Neutralisation(); $('#titable').sticky Table Headers({ scrollable Area: $('#titable').parent() , fixed Offset:-30 }); $( "#acid Slider" ).slider({ value:100, min: 5, max: 200, step: 5, slide: function( event, ui ) { set Float("aconc", ui.value / 100); }, stop: function( event, ui ) { update Neutralisation(); } }); $( "#base Slider" ).slider({ value:100, min: 5, max: 200, step: 5, slide: function( event, ui ) { set Float("bconc", ui.value / 100); }, stop: function( event, ui ) { update Neutralisation(); } }); $( "#stop TSlider" ).slider({ value:500, min: 10, max: 500, step: 10, slide: function( event, ui ) { set Float("stopt", ui.value / 10); } }); page Loaded = true; }); } function draw Chart() { // Create the data table. var data = new google.visualization.Data Table(); data.add Column('number', 'Volume'); data.add Column('number', 'p H'); var rows = $("#titable tbody tr"); for (i = 0; i < rows.length; i++) data.add Row([ parse Float($( rows[i] ).children()[0].inner HTML), parse Float( $( rows[i] ).children()[1].inner HTML ) ]); // Set chart options var options = { h Axis: { title: 'Volume of weak base added / cm3', title Text Style: {color: '#FF0000', bold: 1, italic: 0, font Size: 20, font Name: 'Lucida Sans Unicode' }, view Window: { min: 0, max: 50 }, ticks: [0, 5, 10, 15, 20, 25, 30, 35, 40, 45, 50]}, v Axis: { title: 'p H', title Text Style: {color: '#FF0000', bold: 1, italic: 0, font Size: 20, font Name: 'Lucida Sans Unicode' }, view Window: { min: 0, max: 14 }, ticks: [0,1,2,3,4,5,6,7,8,9,10,11,12,13,14] }, 'chart Area': { top: 20 }, 'legend': {position: 'none'}, 'width':700, 'height':450, line Width: 3, colors: ['black'] }; // Instantiate and draw our chart, passing in some options. var chart = new google.visualization.Line Chart(document.get Element By Id('chart_div')); google.visualization.events.add Listener(chart, 'ready', function() { var gradient = create SVG('linear Gradient', {x1:0,y1:0, x2:0, y1:1}, {id:'fx'}); document.get Element By Id("chart_div").query Selector('svg>defs').append Child(gradient); gradient.append Child(create SVG('stop',{offset:'0%'})); gradient.append Child(create SVG('stop',{offset:'25%'})); gradient.append Child(create SVG('stop',{offset:'50%'})); gradient.append Child(create SVG('stop',{offset:'100%'})); $("svg").find("[clip-path]").parent().find("rect").first().attr("fill", "url(#fx)").attr("fill-opacity", "1"); change Chart Color($("#indtype").val()); }); function select Handler() { var selected Item = chart.get Selection()[0]; if (selected Item) { var p X = data.get Value(selected Item.row, 0).to Fixed(2); var p Y = data.get Value(selected Item.row, 1).to Fixed(2); $("#p X").val(p X); $("#p Y").val(p Y); } } google.visualization.events.add Listener(chart, 'select', select Handler); chart.draw(data, options) } function get Float(id) { return parse Float( $("#"+id).val() ); } function set Float(id, v) { $("#"+id).val( parse Float(v).to Fixed(2) ) ; } function calculatep Kb() { var x = (-Math.log10(get Float("Kb"))).to Fixed(2); $("#p Kb").val(x); if(get Float("p Kb")<2 || get Float("p Kb")>10) {alert("check Kb value, use scientific notation");} } function p HWB() { return 14 + Math.log10(Math.sqrt( get Float("Kb") * get Float("bconc") )); } function p HBB(conc B, conc S) { return 14 - (-Math.log10(get Float("Kb")) + (Math.log10(conc S/conc B))); } function p HWA(conc) { return -Math.log10(Math.sqrt(1e-14/get Float("Kb")*conc)); } function p HSA(conc) { return -Math.log10(conc) } function calculate PH() { if ( burette Vol.to Fixed(2) == 0 ) { return p HSA(get Float("aconc") * get Float("atype")); } else if (burette Vol.to Fixed(2) == get Float("bvol").to Fixed(2) ) { return p HWA(init Mol/tot Vol); } else if (burette Vol < get Float("bvol") ) { return p HSA( (init Mol - burette Vol * get Float("bconc")) / (tot Vol) ); } else if (burette Vol > get Float("bvol") ) { return p HBB( ( burette Vol * get Float("bconc") - init Mol ), (init Mol) ); } } function init Vars() { init Mol = get Float("aconc") * get Float("avol") * get Float("atype"); tot Vol = get Float("avol"); burette Vol = 0; } function titrate Step() { if (init Mol == -1) init Vars(); burette Vol += get Float("inc"); tot Vol += get Float("inc"); $("#titable tbody").html( $("#titable tbody").html() + "<tr><td>" + burette Vol.to Fixed(2) + "</td><td>" + calculate PH().to Fixed(2) + "</td><td>" + tot Vol.to Fixed(2) + "</td></tr>"); $("#titable").parent().scroll Top( $("#titable").height() ) } function update Neutralisation() { $("#bvol").val( ( ( get Float("avol") * get Float("aconc") * get Float("atype") ) / ( get Float("bconc") ) ).to Fixed(2) ); if (get Float("bvol") > 50) {alert("Titre volume cannot exceed maximum capacity of burette!");} else if (get Float("bvol") < 15) {alert("Titre volume too small, leads to large percentage error!");} reset Titrate(); } function auto Titrate() { while ( burette Vol < get Float("stopt")) { titrate Step(); } } function reset Titrate() { $("#titable tbody").html( "" ) draw Chart(); init Vars(); $("#titable tbody").html( $("#titable tbody").html() + "<tr><td>" + burette Vol.to Fixed(2) + "</td><td>" + calculate PH().to Fixed(2) + "</td><td>" + tot Vol.to Fixed(2) + "</td></tr>"); } var chart Col = {'0': ["white", "white", "white", "white"], '1': ["red", "orange", "#ffff33", "#ffff33"], '2': ["#990099", "grey", "#009933", "#009933"], '3': ["white", "white", "white","fuchsia"], '4': ["white", "white", "white","#2c5ba5"], }; function change Chart Color(ind Type) { $("#fx stop:nth-child(1)").css("stop-color",chart Col[ind Type][0]) $("#fx stop:nth-child(2)").css("stop-color",chart Col[ind Type][1]) $("#fx stop:nth-child(3)").css("stop-color",chart Col[ind Type][2]) $("#fx stop:nth-child(4)").css("stop-color",chart Col[ind Type][3]) } function check Boxes() { if (get Float("p X") == 0 && $("#WB").prop('checked')==false && $("#AS").prop('checked')==false && $("#SA").prop('checked')==true) {alert("Good job!");} else if (get Float("p X") < get Float("bvol") && get Float("p X") > 0 && $("#WB").prop('checked')==false && $("#AS").prop('checked')==true && $("#SA").prop('checked')==true) {alert("Good job!");} else if (get Float("p X") > get Float("bvol") && $("#WB").prop('checked')==true && $("#AS").prop('checked')==true && $("#SA").prop('checked')==false) {alert("Good job!");} else if (get Float("p X") == get Float("bvol") && $("#WB").prop('checked')==false && $("#AS").prop('checked')==true && $("#SA").prop('checked')==false) {alert("Good job!");} else {alert("Please try again.");} } function check Buffer() { if ( (14-get Float("p Y")) > (get Float("p Kb")-1) && (14-get Float("p Y")) < (get Float("p Kb")+1) ) { if($("#buffer").prop('checked')==true) {alert("Good job!");} else {alert("Please try again. What are the 2 components required in large excess to form a buffer?");} } else if ( (14-get Float("p Y")) < (get Float("p Kb")-1) || (14-get Float("p Y")) > (get Float("p Kb")+1) ) { if($("#buffer").prop('checked')==false) {alert("Good job!");} else {alert("Please try again. What are the 2 components required in large excess to form a buffer?");} } } </script> <body> <ul> <li><a class="active" a href="index.html">Introduction</a></li> <li><a href="SASB.html">Strong Acid - Strong Base</a></li> <li><a href="SBSA.html">Strong Base - Strong Acid</a></li> <li><a href="WASB.html">Weak Acid - Strong Base</a></li> <li><a href="WBSA.html">Weak Base - Strong Acid</a></li> <li><a href="SBWA.html">Strong Base - Weak Acid</a></li> <li><a href="SAWB.html">Strong Acid - Weak Base</a></li> </ul> <div class="hover_img"> <p style="font-size:20px"><b>Titration Curve of Strong Acid against Weak Base</b> <a href="#">(image)<span><img src="SAWB.png" height=500 border=2 ></span></a></p> </div> <table id='main Table' border=0 cellspacing=5 cellpadding=5> <tr><td><table cellpadding=5 width="20%"> <tr><td colspan=3 class='titlebg'>Set Titration Parameters</td></tr> <tr><td>[acid] = </td><td><input type='input' onchange='update Neutralisation()' class='inputbg box'size="10" id='aconc' value="1.00"/><br /><div id="acid Slider"></td><td>mol dm-3</td></tr> <tr><td>Strong acid is</td><td colspan=2><select id='atype' class='inputbg box' onchange='update Neutralisation()'> <option value=1>monoprotic</option> <option value=2>diprotic</option></select></td></tr> <tr><td width="10%">[base] = </td><td><input type='input' onchange='update Neutralisation()' class='inputbg box' size="10" id='bconc' value="1.00" /><br /><div id="base Slider"></td><td>mol dm-3</td></tr> <tr><td>Kb (scientific notation) = </td><td><input type='input'class='inputbg box' size="10" id='Kb' value="1.80e-5" onchange='calculatep Kb(); update Neutralisation()' /></td><td>mol dm-3</td></tr> <tr><td>p Kb = </td><td><input type='input' class='box'size="10" id='p Kb' value="4.74" disabled /></td></tr> <tr><td>Vol of strong acid in conical flask</td><td><select id='avol' class='inputbg box' onchange="update Neutralisation();"> <option value=25>25.0</option> <option value=10>10.0</option></select></td><td>cm3</td></tr> <tr><td>Vol of weak base req for complete neutralisation</td><td><input type='input'class='box' size="10" id='bvol' value="25.00" disabled /></td><td>cm3</td></tr> <tr><td>Choice of indicator</td><td colspan=2><select id='indtype' class='inputbg box' onchange='change Chart Color(this.value)'> <option value='0'>no indicator</option> <option value='1'>methyl orange</option> <option value='2'>screened methyl orange</option> <option value='3'>phenolphthalein</option> <option value='4'>thymolphthalein</option></select></td></tr> <tr><td>Data points in increments of</td><td><select id='inc' class='inputbg box' value="1.00"> <option value=1.00>1.00</option> <option value=0.50>0.50</option> <option value=0.05>0.05 (1 drop)</option></select></td><td>cm3</td></tr> <tr><td colspan=3></td></tr> <tr><td>Stop titration at (for auto titration only)</td><td><input type='input' onchange='update Neutralisation()' class='inputbg box' size="10" id='stopt' value="50.00" /><br /><div id="stop TSlider"></td><td>cm3</td></tr> <tr><td colspan=3></td></tr> <tr> <td><input type='button' class='button greenbg' value="Do Titration Stepwise" onclick='titrate Step(); draw Chart()'></input></td> <td><input type='button' class='button redbg' value="Auto Titration" onclick='auto Titrate(); draw Chart()'></input></td> <td><input type='button' class='button' value="Reset" onclick='reset Titrate();'></input></td> </tr> </table></td> <td align=center><div id="chart_div"></div> <p class='titlebg'>Selected Point</p> Burette Volume <input type='input' class='box' size="6" id='p X' value="0.00" disabled /> p H <input type='input' class='box' size="6" id='p Y' value="0.00" disabled /><br> Select the major species present in the conical flask<br> <input type="checkbox" id="SA" value="0"> SA <input type="checkbox" id="AS" value="0"> conj acid of WB <input type="checkbox" id="WB" value="0"> xs WB <input type="submit" value="Check" onclick='check Boxes()'><br> Is solution a buffer? <input type="checkbox" id="buffer" value="0"> yes <input type="submit" value="Check" onclick='check Buffer()'> </b> </td> <td> <div style='overflow:scroll; width: 200px; height:550px'> <table id="titable"> <thead><th>Burette Vol</th><th>p H</th><th>Total Vol</th></thead> <html> <style type='text/css'> p {font-family: "Lucida Sans Unicode", "Lucida Grande", sans-serif; margin-top: 20px; margin-left:20px;} #main Table { width: 100%; font-family: "Lucida Sans Unicode", "Lucida Grande", sans-serif} #main Table td { vertical-align:top; font-size: 10pt; } .button { font-family: "Lucida Sans Unicode", "Lucida Grande", sans-serif; font-size: 120%; padding: 10px; width: 100% } .box { font-family: "Lucida Sans Unicode", "Lucida Grande", sans-serif; font-size: 100%; padding: 2px; } #titable th { padding: 5px; margin: 5px;} #titable td { text-align : center } .greenbg { background-color:66FF66 } .redbg { background-color:pink } .inputbg { background-color:FFFF00 } .titlebg { background-color:ccddff; font-weight: bold; line-height: 200%; text-align : center; padding: 5px; margin: 5px; width: 500px} #fx stop:nth-child(1){ stop-color: white; } #fx stop:nth-child(2){ stop-color: white; } #fx stop:nth-child(3){ stop-color: white; } ul {list-style-type: none;margin: 0;padding: 0;overflow: hidden;background-color: ccddff;} li {font-family: "Lucida Sans Unicode", "Lucida Grande", sans-serif; font-size: 80%; float: left;} li a, .dropbtn { display: inline-block; color: black; font-weight: bold; text-align: center; padding: 14px 16px; text-decoration: none; } li a:hover, .dropdown:hover .dropbtn {background-color: 99b3ff;} .hover_img a { position:relative;} .hover_img a span { position:absolute; display:none; z-index:99; background-color: ffffff; left:50%; -webkit-transform: translate X(-50%); -ms-transform: translate X(-50%); transform: translate X(-50%);} .hover_img a:hover span { display:block; } </style> <link rel="stylesheet" href="https://code.jquery.com/ui/1.11.4/themes/smoothness/jquery-ui.css"> <script src="https://ajax.googleapis.com/ajax/libs/jquery/2.2.2/jquery.min.js"></script> <script src="https://code.jquery.com/ui/1.11.4/jquery-ui.js"></script> <script src="https://rawgit.com/jmosbech/Sticky Table Headers/master/js/jquery.stickytableheaders.min.js"></script> <script type="text/javascript" src="https://www.gstatic.com/charts/loader.js"></script> <script type="text/javascript"> google.charts.load('current', {'packages':['corechart']}); // Load the Visualization API and the corechart package. google.charts.set On Load Callback(first Load); // Set a callback to run when the Google Visualization API is loaded. var burette Vol = 0; var init Mol = -1; var tot Vol = 0; function create SVG(n,a,b){ var xmlns = "http://www.w3.org/2000/svg"; var e = document.create Element NS (xmlns, n); for(var k in a){ e.set Attribute NS (null, k,a[k]); } for(var k in b){ e.set Attribute (k,b[k]); } return e; }; function first Load() { $(document).ready( function() { $("#titable tbody").html( $("#titable tbody").html() + "<tr><td>" + burette Vol.to Fixed(2) + "</td><td>" + calculate PH().to Fixed(2) + "</td><td>" + tot Vol.to Fixed(2) + "</td></tr>"); update Neutralisation(); $('#titable').sticky Table Headers({ scrollable Area: $('#titable').parent() , fixed Offset:-30 }); $( "#acid Slider" ).slider({ value:100, min: 5, max: 200, step: 5, slide: function( event, ui ) { set Float("aconc", ui.value / 100); }, stop: function( event, ui ) { update Neutralisation(); } }); $( "#base Slider" ).slider({ value:100, min: 5, max: 200, step: 5, slide: function( event, ui ) { set Float("bconc", ui.value / 100); }, stop: function( event, ui ) { update Neutralisation(); } }); $( "#stop TSlider" ).slider({ value:500, min: 10, max: 500, step: 10, slide: function( event, ui ) { set Float("stopt", ui.value / 10); } }); page Loaded = true; }); } function draw Chart() { // Create the data table. var data = new google.visualization.Data Table(); data.add Column('number', 'Volume'); data.add Column('number', 'p H'); var rows = $("#titable tbody tr"); for (i = 0; i < rows.length; i++) data.add Row([ parse Float($( rows[i] ).children()[0].inner HTML), parse Float( $( rows[i] ).children()[1].inner HTML ) ]); // Set chart options var options = { h Axis: { title: 'Volume of strong acid added / cm3', title Text Style: {color: '#FF0000', bold: 1, italic: 0, font Size: 20, font Name: 'Lucida Sans Unicode' }, view Window: { min: 0, max: 50 }, ticks: [0, 5, 10, 15, 20, 25, 30, 35, 40, 45, 50]}, v Axis: { title: 'p H', title Text Style: {color: '#FF0000', bold: 1, italic: 0, font Size: 20, font Name: 'Lucida Sans Unicode' }, view Window: { min: 0, max: 14 }, ticks: [0,1,2,3,4,5,6,7,8,9,10,11,12,13,14] }, 'chart Area': { top: 20 }, 'legend': {position: 'none'}, 'width':700, 'height':450, line Width: 3, colors: ['black'] }; // Instantiate and draw our chart, passing in some options. var chart = new google.visualization.Line Chart(document.get Element By Id('chart_div')); google.visualization.events.add Listener(chart, 'ready', function() { var gradient = create SVG('linear Gradient', {x1:0,y1:0, x2:0, y1:1}, {id:'fx'}); document.get Element By Id("chart_div").query Selector('svg>defs').append Child(gradient); gradient.append Child(create SVG('stop',{offset:'0%'})); gradient.append Child(create SVG('stop',{offset:'25%'})); gradient.append Child(create SVG('stop',{offset:'50%'})); gradient.append Child(create SVG('stop',{offset:'100%'})); $("svg").find("[clip-path]").parent().find("rect").first().attr("fill", "url(#fx)").attr("fill-opacity", "1"); change Chart Color($("#indtype").val()); }); function select Handler() { var selected Item = chart.get Selection()[0]; if (selected Item) { set Float( "p X", data.get Value(selected Item.row, 0) ); set Float( "p Y", data.get Value(selected Item.row, 1) ); } } google.visualization.events.add Listener(chart, 'select', select Handler); chart.draw(data, options) } function get Float(id) { return parse Float( $("#"+id).val() ); } function set Float(id, v) { $("#"+id).val( parse Float(v).to Fixed(2) ) ; } function p HSA(conc) { return -Math.log10(conc); } function p HSB(conc) { return 14 + Math.log10(conc) } function calculate PH() { if (burette Vol.to Fixed(2) == get Float("avol").to Fixed(2) ){ return 7.0; } else if (burette Vol < get Float("avol") ) { return p HSB( ( init Mol - burette Vol * get Float("aconc") * get Float("atype") ) / (tot Vol) ); } else if (burette Vol > get Float("avol") ) { return p HSA(( ( burette Vol * get Float("aconc") * get Float("atype") ) - init Mol ) / (tot Vol) ); } } function init Vars() { init Mol = get Float("bconc") * get Float("bvol") * get Float("btype"); tot Vol = get Float("bvol"); burette Vol = 0; } function titrate Step() { if (init Mol == -1) init Vars(); burette Vol += get Float("inc"); tot Vol += get Float("inc"); $("#titable tbody").html( $("#titable tbody").html() + "<tr><td>" + burette Vol.to Fixed(2) + "</td><td>" + calculate PH().to Fixed(2) + "</td><td>" + tot Vol.to Fixed(2) + "</td></tr>"); $("#titable").parent().scroll Top( $("#titable").height() ) } function update Neutralisation() { set Float("avol", get Float("bvol") * get Float("btype") * get Float("bconc") / (get Float("atype") * get Float("aconc")) ); if (get Float("avol") > 50) {alert("Titre volume cannot exceed maximum capacity of burette!");} else if (get Float("avol") < 15) {alert("Titre volume too small, leads to large percentage error!");} reset Titrate(); } function auto Titrate() { while ( burette Vol < get Float("stopt")) { titrate Step(); } } function reset Titrate() { $("#titable tbody").html( "" ) draw Chart(); init Vars(); $("#titable tbody").html( $("#titable tbody").html() + "<tr><td>" + burette Vol.to Fixed(2) + "</td><td>" + calculate PH().to Fixed(2) + "</td><td>" + tot Vol.to Fixed(2) + "</td></tr>"); } var chart Col = {'0': ["white", "white", "white", "white"], '1': ["red", "orange", "#ffff33", "#ffff33"], '2': ["#990099", "grey", "#009933", "#009933"], '3': ["white", "white", "white","fuchsia"], '4': ["white", "white", "white","#2c5ba5"], }; function change Chart Color(ind Type) { $("#fx stop:nth-child(1)").css("stop-color",chart Col[ind Type][0]) $("#fx stop:nth-child(2)").css("stop-color",chart Col[ind Type][1]) $("#fx stop:nth-child(3)").css("stop-color",chart Col[ind Type][2]) $("#fx stop:nth-child(4)").css("stop-color",chart Col[ind Type][3]) } function check Boxes() { if (get Float("p X") < get Float("avol") && get Float("p X") > 0 && $("#SB").prop('checked')==true && $("#NS").prop('checked')==true && $("#SA").prop('checked')==false) {alert("Good job!");} else if (get Float("p X") > get Float("avol") && $("#SB").prop('checked')==false && $("#NS").prop('checked')==true && $("#SA").prop('checked')==true) {alert("Good job!");} else if (get Float("p X") == get Float("avol") && $("#SB").prop('checked')==false && $("#NS").prop('checked')==true && $("#SA").prop('checked')==false) {alert("Good job!");} else if (get Float("p X") == 0 && $("#SB").prop('checked')==true && $("#NS").prop('checked')==false && $("#SA").prop('checked')==false) {alert("Good job!");} else {alert("Please try again.");} } </script> <body> <ul> <li><a class="active" a href="index.html">Introduction</a></li> <li><a href="SASB.html">Strong Acid - Strong Base</a></li> <li><a href="SBSA.html">Strong Base - Strong Acid</a></li> <li><a href="WASB.html">Weak Acid - Strong Base</a></li> <li><a href="WBSA.html">Weak Base - Strong Acid</a></li> <li><a href="SBWA.html">Strong Base - Weak Acid</a></li> <li><a href="SAWB.html">Strong Acid - Weak Base</a></li> </ul> <div class="hover_img"> <p style="font-size:20px"><b>Titration Curve of Strong Base against Strong Acid</b> <a href="#">(image)<span><img src="SBSA.png" height=500 border=2 ></span></a></p> </div> <table id='main Table' border=0 cellspacing=5 cellpadding=5> <tr><td><table cellpadding=5 width="20%"> <tr><td colspan=3 class='titlebg'>Set Titration Parameters</td></tr> <tr><td>[base] = </td><td><input type='input' onchange='update Neutralisation()' class='inputbg box'size="10" id='bconc' value="1.00"/><br /><div id="base Slider"></td><td>mol dm-3</td></tr> <tr><td>Strong base is</td><td colspan=2><select id='btype' class='inputbg box' onchange='update Neutralisation()'> <option value=1>monoprotic</option> <option value=2>diprotic</option></select></td></tr> <tr><td width="10%">[acid] = </td><td><input type='input' onchange='update Neutralisation()' class='inputbg box' size="10" id='aconc' value="1.00" /><br /><div id="acid Slider"></td><td>mol dm-3</td></tr> <tr><td>Strong acid is</td><td colspan=2><select id='atype' class='inputbg box' onchange='update Neutralisation()'> <option value=1>monoprotic</option> <option value=2>diprotic</option></select></td></tr> <tr><td>Vol of strong base in conical flask</td><td><select id='bvol' class='inputbg box' onchange="update Neutralisation();"> <option value=25>25.0</option> <option value=10>10.0</option></select></td><td>cm3</td></tr> <tr><td>Vol of strong acid req for complete neutralisation</td><td><input type='input'class='box' size="10" id='avol' value="25.00" disabled /></td><td>cm3</td></tr> <tr><td>Choice of indicator</td><td colspan=2><select id='indtype' class='inputbg box' onchange='change Chart Color(this.value)'> <option value='0'>no indicator</option> <option value='1'>methyl orange</option> <option value='2'>screened methyl orange</option> <option value='3'>phenolphthalein</option> <option value='4'>thymolphthalein</option></select></td></tr> <tr><td>Data points in increments of</td><td><select id='inc' class='inputbg box' value="1.00"> <option value=1.00>1.00</option> <option value=0.50>0.50</option> <option value=0.05>0.05 (1 drop)</option></select></td><td>cm3</td></tr> <tr><td colspan=3></td></tr> <tr><td>Stop titration at (for auto titration only)</td><td><input type='input' onchange='update Neutralisation()' class='inputbg box' size="10" id='stopt' value="50.00" /><br /><div id="stop TSlider"></td><td>cm3</td></tr> <tr><td colspan=3></td></tr> <tr> <td><input type='button' class='button greenbg' value="Do Titration Stepwise" onclick='titrate Step(); draw Chart()'></input></td> <td><input type='button' class='button redbg' value="Auto Titration" onclick='auto Titrate(); draw Chart()'></input></td> <td><input type='button' class='button' value="Reset" onclick='reset Titrate();'></input></td> </tr> </table></td> <td align=center><div id="chart_div"></div> <p class='titlebg'>Selected Point</p> Burette Volume <input type='input' class='box' size="6" id='p X' value="0.00" disabled /> p H <input type='input' class='box' size="6" id='p Y' value="0.00" disabled /><br> Select all the species present in the conical flask<br> <input type="checkbox" id="SB" value="0"> strong base <input type="checkbox" id="NS" value="0"> neutral salt <input type="checkbox" id="SA" value="0"> strong acid <input type="submit" value="Check" onclick='check Boxes()'> </b> </td> <td> <div style='overflow:scroll; width: 200px; height:550px'> <table id="titable"> <thead><th>Burette Vol</th><th>p H</th><th>Total Vol</th></thead> <tbody></tbody> </table> </div> </td> </tr> </table> </body> </html> <html> <style type='text/css'> p {font-family: "Lucida Sans Unicode", "Lucida Grande", sans-serif; margin-top: 20px; margin-left:20px;} #main Table { width: 100%; font-family: "Lucida Sans Unicode", "Lucida Grande", sans-serif} #main Table td { vertical-align:top; font-size: 10pt; } .button { font-family: "Lucida Sans Unicode", "Lucida Grande", sans-serif; font-size: 120%; padding: 10px; width: 100% } .box { font-family: "Lucida Sans Unicode", "Lucida Grande", sans-serif; font-size: 100%; padding: 2px; } #titable th { padding: 5px; margin: 5px;} #titable td { text-align : center } .greenbg { background-color:66FF66 } .redbg { background-color:pink } .inputbg { background-color:FFFF00 } .titlebg { background-color:ccddff; font-weight: bold; line-height: 200%; text-align : center; padding: 5px; margin: 5px; width: 500px} #fx stop:nth-child(1){ stop-color: white; } #fx stop:nth-child(2){ stop-color: white; } #fx stop:nth-child(3){ stop-color: white; } ul {list-style-type: none;margin: 0;padding: 0;overflow: hidden;background-color: ccddff;} li {font-family: "Lucida Sans Unicode", "Lucida Grande", sans-serif; font-size: 80%; float: left;} li a, .dropbtn { display: inline-block; color: black; font-weight: bold; text-align: center; padding: 14px 16px; text-decoration: none; } li a:hover, .dropdown:hover .dropbtn {background-color: 99b3ff;} .hover_img a { position:relative;} .hover_img a span { position:absolute; display:none; z-index:99; background-color: ffffff; left:50%; -webkit-transform: translate X(-50%); -ms-transform: translate X(-50%); transform: translate X(-50%);} .hover_img a:hover span { display:block; } </style> <link rel="stylesheet" href="https://code.jquery.com/ui/1.11.4/themes/smoothness/jquery-ui.css"> <script src="https://ajax.googleapis.com/ajax/libs/jquery/2.2.2/jquery.min.js"></script> <script src="https://code.jquery.com/ui/1.11.4/jquery-ui.js"></script> <script src="https://rawgit.com/jmosbech/Sticky Table Headers/master/js/jquery.stickytableheaders.min.js"></script> <script type="text/javascript" src="https://www.gstatic.com/charts/loader.js"></script> <script type="text/javascript"> google.charts.load('current', {'packages':['corechart']}); // Load the Visualization API and the corechart package. google.charts.set On Load Callback(first Load); // Set a callback to run when the Google Visualization API is loaded. var burette Vol = 0; var init Mol = -1; var tot Vol = 0; function create SVG(n,a,b){ var xmlns = "http://www.w3.org/2000/svg"; var e = document.create Element NS (xmlns, n); for(var k in a){ e.set Attribute NS (null, k,a[k]); } for(var k in b){ e.set Attribute (k,b[k]); } return e; }; function first Load() { $(document).ready( function() { $("#titable tbody").html( $("#titable tbody").html() + "<tr><td>" + burette Vol.to Fixed(2) + "</td><td>" + calculate PH().to Fixed(2) + "</td><td>" + tot Vol.to Fixed(2) + "</td></tr>"); update Neutralisation(); $('#titable').sticky Table Headers({ scrollable Area: $('#titable').parent() , fixed Offset:-30 }); $( "#acid Slider" ).slider({ value:100, min: 5, max: 200, step: 5, slide: function( event, ui ) { set Float("aconc", ui.value / 100); }, stop: function( event, ui ) { update Neutralisation(); } }); $( "#base Slider" ).slider({ value:100, min: 5, max: 200, step: 5, slide: function( event, ui ) { set Float("bconc", ui.value / 100); }, stop: function( event, ui ) { update Neutralisation(); } }); $( "#stop TSlider" ).slider({ value:500, min: 10, max: 500, step: 10, slide: function( event, ui ) { set Float("stopt", ui.value / 10); } }); page Loaded = true; }); } function draw Chart() { // Create the data table. var data = new google.visualization.Data Table(); data.add Column('number', 'Volume'); data.add Column('number', 'p H'); var rows = $("#titable tbody tr"); for (i = 0; i < rows.length; i++) data.add Row([ parse Float($( rows[i] ).children()[0].inner HTML), parse Float( $( rows[i] ).children()[1].inner HTML ) ]); // Set chart options var options = { h Axis: { title: 'Volume of weak acid added / cm3', title Text Style: {color: '#FF0000', bold: 1, italic: 0, font Size: 20, font Name: 'Lucida Sans Unicode' }, view Window: { min: 0, max: 50 }, ticks: [0, 5, 10, 15, 20, 25, 30, 35, 40, 45, 50]}, v Axis: { title: 'p H', title Text Style: {color: '#FF0000', bold: 1, italic: 0, font Size: 20, font Name: 'Lucida Sans Unicode' }, view Window: { min: 0, max: 14 }, ticks: [0,1,2,3,4,5,6,7,8,9,10,11,12,13,14] }, 'chart Area': { top: 20 }, 'legend': {position: 'none'}, 'width':700, 'height':450, line Width: 3, colors: ['black'] }; // Instantiate and draw our chart, passing in some options. var chart = new google.visualization.Line Chart(document.get Element By Id('chart_div')); google.visualization.events.add Listener(chart, 'ready', function() { var gradient = create SVG('linear Gradient', {x1:0,y1:0, x2:0, y1:1}, {id:'fx'}); document.get Element By Id("chart_div").query Selector('svg>defs').append Child(gradient); gradient.append Child(create SVG('stop',{offset:'0%'})); gradient.append Child(create SVG('stop',{offset:'25%'})); gradient.append Child(create SVG('stop',{offset:'50%'})); gradient.append Child(create SVG('stop',{offset:'100%'})); $("svg").find("[clip-path]").parent().find("rect").first().attr("fill", "url(#fx)").attr("fill-opacity", "1"); change Chart Color($("#indtype").val()); }); function select Handler() { var selected Item = chart.get Selection()[0]; if (selected Item) { var p X = data.get Value(selected Item.row, 0).to Fixed(2); var p Y = data.get Value(selected Item.row, 1).to Fixed(2); $("#p X").val(p X); $("#p Y").val(p Y); } } google.visualization.events.add Listener(chart, 'select', select Handler); chart.draw(data, options) } function get Float(id) { return parse Float( $("#"+id).val() ); } function set Float(id, v) { $("#"+id).val( parse Float(v).to Fixed(2) ) ; } function calculatep Ka() { var x = (- Math.log10(get Float("Ka"))).to Fixed(2); $("#p Ka").val(x); if(get Float("p Ka")<2 || get Float("p Ka")>10) {alert("check Ka value, use scientific notation");} } function p HWA() { return -Math.log10(Math.sqrt( get Float("Ka") * get Float("aconc") )); } function p HAB(conc A, conc S) { return -Math.log10(get Float("Ka")) + (Math.log10(conc S/conc A)); } //not tested function p HWB(conc) { return 14+Math.log10(Math.sqrt(1e-14/get Float("Ka")*conc)); } function p HSB(conc) { return 14 + Math.log10(conc) } function calculate PH() { if ( burette Vol.to Fixed(2) == 0 ) { return p HSB(get Float("bconc") * get Float("btype")); } else if (burette Vol.to Fixed(2) == get Float("avol").to Fixed(2) ) { return p HWB(init Mol/tot Vol); } else if (burette Vol < get Float("avol") ) { return p HSB( (init Mol - burette Vol * get Float("aconc") ) / tot Vol ); } else if (burette Vol > get Float("avol") ) { return p HAB( ( burette Vol * get Float("aconc") - init Mol ) , init Mol ); } } function init Vars() { init Mol = get Float("bconc") * get Float("bvol") * get Float("btype"); tot Vol = get Float("bvol"); burette Vol = 0; } function titrate Step() { if (init Mol == -1) init Vars(); burette Vol += get Float("inc"); tot Vol += get Float("inc"); $("#titable tbody").html( $("#titable tbody").html() + "<tr><td>" + burette Vol.to Fixed(2) + "</td><td>" + calculate PH().to Fixed(2) + "</td><td>" + tot Vol.to Fixed(2) + "</td></tr>"); $("#titable").parent().scroll Top( $("#titable").height() ) } function update Neutralisation() { $("#avol").val( ( get Float("bvol") * get Float("bconc") * get Float("btype") / get Float("aconc") ).to Fixed(2) ); if (get Float("avol") > 50) {alert("Titre volume cannot exceed maximum capacity of burette!");} else if (get Float("avol") < 15) {alert("Titre volume too small, leads to large percentage error!");} reset Titrate(); } function auto Titrate() { while ( burette Vol < get Float("stopt")) { titrate Step(); } } function reset Titrate() { $("#titable tbody").html( "" ) draw Chart(); init Vars(); $("#titable tbody").html( $("#titable tbody").html() + "<tr><td>" + burette Vol.to Fixed(2) + "</td><td>" + calculate PH().to Fixed(2) + "</td><td>" + tot Vol.to Fixed(2) + "</td></tr>"); } var chart Col = {'0': ["white", "white", "white", "white"], '1': ["red", "orange", "#ffff33", "#ffff33"], '2': ["#990099", "grey", "#009933", "#009933"], '3': ["white", "white", "white","fuchsia"], '4': ["white", "white", "white","#2c5ba5"], }; function change Chart Color(ind Type) { $("#fx stop:nth-child(1)").css("stop-color",chart Col[ind Type][0]) $("#fx stop:nth-child(2)").css("stop-color",chart Col[ind Type][1]) $("#fx stop:nth-child(3)").css("stop-color",chart Col[ind Type][2]) $("#fx stop:nth-child(4)").css("stop-color",chart Col[ind Type][3]) } function check Boxes() { if (get Float("p X") == 0 && $("#WA").prop('checked')==false && $("#BS").prop('checked')==false && $("#SB").prop('checked')==true) {alert("Good job!");} else if (get Float("p X") < get Float("avol") && get Float("p X") > 0 && $("#WA").prop('checked')==false && $("#BS").prop('checked')==true && $("#SB").prop('checked')==true) {alert("Good job!");} else if (get Float("p X") > get Float("avol") && $("#WA").prop('checked')==true && $("#BS").prop('checked')==true && $("#SB").prop('checked')==false) {alert("Good job!");} else if (get Float("p X") == get Float("avol") && $("#WA").prop('checked')==false && $("#BS").prop('checked')==true && $("#SB").prop('checked')==false) {alert("Good job!");} else {alert("Please try again.");} } function check Buffer() { if ( get Float("p Y") > (get Float("p Ka")-1) && get Float("p Y") < (get Float("p Ka")+1) ) { if($("#buffer").prop('checked')==true) {alert("Good job!");} else {alert("Please try again. What are the 2 components required in large excess to form a buffer?");} } if (get Float("p Y") < (get Float("p Ka")-1) || get Float("p Y") > (get Float("p Ka")+1)) { if($("#buffer").prop('checked')==false) {alert("Good job!");} else {alert("Please try again. What are the 2 components required in large excess to form a buffer?");} } } </script> <body> <ul> <li><a class="active" a href="index.html">Introduction</a></li> <li><a href="SASB.html">Strong Acid - Strong Base</a></li> <li><a href="SBSA.html">Strong Base - Strong Acid</a></li> <li><a href="WASB.html">Weak Acid - Strong Base</a></li> <li><a href="WBSA.html">Weak Base - Strong Acid</a></li> <li><a href="SBWA.html">Strong Base - Weak Acid</a></li> <li><a href="SAWB.html">Strong Acid - Weak Base</a></li> </ul> <div class="hover_img"> <p style="font-size:20px"><b>Titration Curve of Strong Base against Weak Acid</b> <a href="#">(image)<span><img src="SBWA.png" height=500 border=2 ></span></a></p> </div> <table id='main Table' border=0 cellspacing=5 cellpadding=5> <tr><td><table cellpadding=5 width="20%"> <tr><td colspan=3 class='titlebg'>Set Titration Parameters</td></tr> <tr><td>[base] = </td><td><input type='input' onchange='update Neutralisation()' class='inputbg box'size="10" id='bconc' value="1.00"/><br /><div id="base Slider"></td><td>mol dm-3</td></tr> <tr><td>Strong base is</td><td colspan=2><select id='btype' class='inputbg box' onchange='update Neutralisation()'> <option value=1>monoprotic</option> <option value=2>diprotic</option></select></td></tr> <tr><td width="10%">[acid] = </td><td><input type='input' onchange='update Neutralisation()' class='inputbg box' size="10" id='aconc' value="1.00" /><br /><div id="acid Slider"></td><td>mol dm-3</td></tr> <tr><td>Ka (scientific notation) = </td><td><input type='input'class='inputbg box' size="10" id='Ka' value="1.80e-5" onchange='calculatep Ka(); update Neutralisation()' /></td><td>mol dm-3</td></tr> <tr><td>p Ka = </td><td><input type='input' class='box'size="10" id='p Ka' value="4.74" disabled /></td></tr> <tr><td>Vol of strong base in conical flask</td><td><select id='bvol' class='inputbg box' onchange="update Neutralisation();"> <option value=25>25.0</option> <option value=10>10.0</option></select></td><td>cm3</td></tr> <tr><td>Vol of weak acid req for complete neutralisation</td><td><input type='input'class='box' size="10" id='avol' value="25.00" disabled /></td><td>cm3</td></tr> <tr><td>Choice of indicator</td><td colspan=2><select id='indtype' class='inputbg box' onchange='change Chart Color(this.value)'> <option value='0'>no indicator</option> <option value='1'>methyl orange</option> <option value='2'>screened methyl orange</option> <option value='3'>phenolphthalein</option> <option value='4'>thymolphthalein</option></select></td></tr> <tr><td>Data points in increments of</td><td><select id='inc' class='inputbg box' value="1.00"> <option value=1.00>1.00</option> <option value=0.50>0.50</option> <option value=0.05>0.05 (1 drop)</option></select></td><td>cm3</td></tr> <tr><td colspan=3></td></tr> <tr><td>Stop titration at (for auto titration only)</td><td><input type='input' onchange='update Neutralisation()' class='inputbg box' size="10" id='stopt' value="50.00" /><br /><div id="stop TSlider"></td><td>cm3</td></tr> <tr><td colspan=3></td></tr> <tr> <td><input type='button' class='button greenbg' value="Do Titration Stepwise" onclick='titrate Step(); draw Chart()'></input></td> <td><input type='button' class='button redbg' value="Auto Titration" onclick='auto Titrate(); draw Chart()'></input></td> <td><input type='button' class='button' value="Reset" onclick='reset Titrate();'></input></td> </tr> </table></td> <td align=center><div id="chart_div"></div> <p class='titlebg'>Selected Point</p> Burette Volume <input type='input' class='box' size="6" id='p X' value="0.00" disabled /> p H <input type='input' class='box' size="6" id='p Y' value="0.00" disabled /><br> Select the major species present in the conical flask<br> <input type="checkbox" id="SB" value="0"> SB <input type="checkbox" id="BS" value="0"> conj base of WA <input type="checkbox" id="WA" value="0"> xs WA <input type="submit" value="Check" onclick='check Boxes()'><br> Is solution a buffer? <input type="checkbox" id="buffer" value="0"> yes <input type="submit" value="Check" onclick='check Buffer()'> </b> </td> <td> <div style='overflow:scroll; width: 200px; height:550px'> <table id="titable"> <thead><th>Burette Vol</th><th>p H</th><th>Tot Vol</th></thead> <tbody></tbody> </tabl <html> <style type='text/css'> p {font-family: "Lucida Sans Unicode", "Lucida Grande", sans-serif; margin-top: 20px; margin-left:20px;} #main Table { width: 100%; font-family: "Lucida Sans Unicode", "Lucida Grande", sans-serif} #main Table td { vertical-align:top; font-size: 10pt; } .button { font-family: "Lucida Sans Unicode", "Lucida Grande", sans-serif; font-size: 120%; padding: 10px; width: 100% } .box { font-family: "Lucida Sans Unicode", "Lucida Grande", sans-serif; font-size: 100%; padding: 2px; } #titable th { padding: 5px; margin: 5px;} #titable td { text-align : center } .greenbg { background-color:66FF66 } .redbg { background-color:pink } .inputbg { background-color:FFFF00 } .titlebg { background-color:ccddff; font-weight: bold; line-height: 200%; text-align : center; padding: 5px; margin: 5px; width: 500px} #fx stop:nth-child(1){ stop-color: white; } #fx stop:nth-child(2){ stop-color: white; } #fx stop:nth-child(3){ stop-color: white; } ul {list-style-type: none;margin: 0;padding: 0;overflow: hidden;background-color: ccddff;} li {font-family: "Lucida Sans Unicode", "Lucida Grande", sans-serif; font-size: 80%; float: left;} li a, .dropbtn { display: inline-block; color: black; font-weight: bold; text-align: center; padding: 14px 16px; text-decoration: none; } li a:hover, .dropdown:hover .dropbtn {background-color: 99b3ff;} .hover_img a { position:relative;} .hover_img a span { position:absolute; display:none; z-index:99; background-color: ffffff; left:50%; -webkit-transform: translate X(-50%); -ms-transform: translate X(-50%); transform: translate X(-50%);} .hover_img a:hover span { display:block; } </style> <link rel="stylesheet" href="https://code.jquery.com/ui/1.11.4/themes/smoothness/jquery-ui.css"> <script src="https://ajax.googleapis.com/ajax/libs/jquery/2.2.2/jquery.min.js"></script> <script src="https://code.jquery.com/ui/1.11.4/jquery-ui.js"></script> <script src="https://rawgit.com/jmosbech/Sticky Table Headers/master/js/jquery.stickytableheaders.min.js"></script> <script type="text/javascript" src="https://www.gstatic.com/charts/loader.js"></script> <script type="text/javascript"> google.charts.load('current', {'packages':['corechart']}); // Load the Visualization API and the corechart package. google.charts.set On Load Callback(first Load); // Set a callback to run when the Google Visualization API is loaded. var burette Vol = 0; var init Mol = -1; var tot Vol = 0; function create SVG(n,a,b){ var xmlns = "http://www.w3.org/2000/svg"; var e = document.create Element NS (xmlns, n); for(var k in a){ e.set Attribute NS (null, k,a[k]); } for(var k in b){ e.set Attribute (k,b[k]); } return e; }; function first Load() { $(document).ready( function() { $("#titable tbody").html( $("#titable tbody").html() + "<tr><td>" + burette Vol.to Fixed(2) + "</td><td>" + calculate PH().to Fixed(2) + "</td><td>" + tot Vol.to Fixed(2) + "</td></tr>"); update Neutralisation(); $('#titable').sticky Table Headers({ scrollable Area: $('#titable').parent() , fixed Offset:-30 }); $( "#acid Slider" ).slider({ value:100, min: 5, max: 200, step: 5, slide: function( event, ui ) { set Float("aconc", ui.value / 100); }, stop: function( event, ui ) { update Neutralisation(); } }); $( "#base Slider" ).slider({ value:100, min: 5, max: 200, step: 5, slide: function( event, ui ) { set Float("bconc", ui.value / 100); }, stop: function( event, ui ) { update Neutralisation(); } }); $( "#stop TSlider" ).slider({ value:500, min: 10, max: 500, step: 10, slide: function( event, ui ) { set Float("stopt", ui.value / 10); } }); page Loaded = true; }); } function draw Chart() { // Create the data table. var data = new google.visualization.Data Table(); data.add Column('number', 'Volume'); data.add Column('number', 'p H'); var rows = $("#titable tbody tr"); for (i = 0; i < rows.length; i++) data.add Row([ parse Float($( rows[i] ).children()[0].inner HTML), parse Float( $( rows[i] ).children()[1].inner HTML ) ]); // Set chart options var options = { h Axis: { title: 'Volume of strong base added / cm3', title Text Style: {color: '#FF0000', bold: 1, italic: 0, font Size: 20, font Name: 'Lucida Sans Unicode' }, view Window: { min: 0, max: 50 }, ticks: [0, 5, 10, 15, 20, 25, 30, 35, 40, 45, 50]}, v Axis: { title: 'p H', title Text Style: {color: '#FF0000', bold: 1, italic: 0, font Size: 20, font Name: 'Lucida Sans Unicode' }, view Window: { min: 0, max: 14 }, ticks: [0,1,2,3,4,5,6,7,8,9,10,11,12,13,14] }, 'chart Area': { top: 20 }, 'legend': {position: 'none'}, 'width':700, 'height':450, line Width: 3, colors: ['black'] }; // Instantiate and draw our chart, passing in some options. var chart = new google.visualization.Line Chart(document.get Element By Id('chart_div')); google.visualization.events.add Listener(chart, 'ready', function() { var gradient = create SVG('linear Gradient', {x1:0,y1:0, x2:0, y1:1}, {id:'fx'}); document.get Element By Id("chart_div").query Selector('svg>defs').append Child(gradient); gradient.append Child(create SVG('stop',{offset:'0%'})); gradient.append Child(create SVG('stop',{offset:'25%'})); gradient.append Child(create SVG('stop',{offset:'50%'})); gradient.append Child(create SVG('stop',{offset:'100%'})); $("svg").find("[clip-path]").parent().find("rect").first().attr("fill", "url(#fx)").attr("fill-opacity", "1"); change Chart Color($("#indtype").val()); }); function select Handler() { var selected Item = chart.get Selection()[0]; if (selected Item) { var p X = data.get Value(selected Item.row, 0).to Fixed(2); var p Y = data.get Value(selected Item.row, 1).to Fixed(2); $("#p X").val(p X); $("#p Y").val(p Y); } } google.visualization.events.add Listener(chart, 'select', select Handler); chart.draw(data, options) } function get Float(id) { return parse Float( $("#"+id).val() ); } function set Float(id, v) { $("#"+id).val( parse Float(v).to Fixed(2) ) ; } function calculatep Ka() { var x = (- Math.log10(get Float("Ka"))).to Fixed(2); $("#p Ka").val(x); if(get Float("p Ka")<2 || get Float("p Ka")>10) {alert("check Ka value, use scientific notation");} } function p HWA() { return -Math.log10(Math.sqrt( get Float("Ka") * get Float("aconc") )); } function p HAB(conc A, conc S) { return -Math.log10(get Float("Ka")) + Math.log10(conc S/conc A); } function p HWB(conc) { return 14+Math.log10(Math.sqrt(1e-14/get Float("Ka")*conc)); } function p HSB(conc) { return 14 + Math.log10(conc) } function calculate PH() { if ( burette Vol.to Fixed(2) == 0 ) { return p HWA(); } else if (burette Vol.to Fixed(2) == get Float("bvol").to Fixed(2) ) { return p HWB(init Mol/tot Vol); } else if (burette Vol < get Float("bvol") ) { return p HAB( parse Float( init Mol - burette Vol * get Float("bconc") * get Float("btype") ), parse Float(burette Vol * get Float("bconc") * get Float("btype")) ); } else if (burette Vol > get Float("bvol") ) { return p HSB( ( burette Vol * get Float("bconc") * get Float("btype") - init Mol ) / (tot Vol) ); } } function init Vars() { init Mol = get Float("aconc") * get Float("avol"); tot Vol = get Float("avol"); burette Vol = 0; } function titrate Step() { if (init Mol == -1) init Vars(); burette Vol += get Float("inc"); tot Vol += get Float("inc"); $("#titable tbody").html( $("#titable tbody").html() + "<tr><td>" + burette Vol.to Fixed(2) + "</td><td>" + calculate PH().to Fixed(2) + "</td><td>" + tot Vol.to Fixed(2) + "</td></tr>"); } function update Neutralisation() { set Float("bvol", (( get Float("avol") * get Float("aconc") ) / ( get Float("btype") * get Float("bconc")))); if (get Float("bvol") > 50) {alert("Titre volume cannot exceed maximum capacity of burette!");} else if (get Float("bvol") < 15) {alert("Titre volume too small, leads to large percentage error!");} reset Titrate(); } function auto Titrate() { while ( burette Vol < get Float("stopt")) { titrate Step(); } } function reset Titrate() { $("#titable tbody").html( "" ) draw Chart(); init Vars(); $("#titable tbody").html( $("#titable tbody").html() + "<tr><td>" + burette Vol.to Fixed(2) + "</td><td>" + calculate PH().to Fixed(2) + "</td><td>" + tot Vol.to Fixed(2) + "</td></tr>"); } var chart Col = {'0': ["white", "white", "white", "white"], '1': ["red", "orange", "#ffff33", "#ffff33"], '2': ["#990099", "grey", "#009933", "#009933"], '3': ["white", "white", "white","fuchsia"], '4': ["white", "white", "white","#2c5ba5"], }; function change Chart Color(ind Type) { $("#fx stop:nth-child(1)").css("stop-color",chart Col[ind Type][0]) $("#fx stop:nth-child(2)").css("stop-color",chart Col[ind Type][1]) $("#fx stop:nth-child(3)").css("stop-color",chart Col[ind Type][2]) $("#fx stop:nth-child(4)").css("stop-color",chart Col[ind Type][3]) } function check Boxes() { if (get Float("p X") == 0 && $("#WA").prop('checked')==true && $("#BS").prop('checked')==false && $("#SB").prop('checked')==false) {alert("Good job!");} else if (get Float("p X") < get Float("bvol") && get Float("p X") > 0 && $("#WA").prop('checked')==true && $("#BS").prop('checked')==true && $("#SB").prop('checked')==false) {alert("Good job!");} else if (get Float("p X") > get Float("bvol") && $("#WA").prop('checked')==false && $("#BS").prop('checked')==true && $("#SB").prop('checked')==true) {alert("Good job!");} else if (get Float("p X") == get Float("bvol") && $("#WA").prop('checked')==false && $("#BS").prop('checked')==true && $("#SB").prop('checked')==false) {alert("Good job!");} else {alert("Please try again.");} } function check Buffer() { if ( get Float("p Y") > (get Float("p Ka")-1) && get Float("p Y") < (get Float("p Ka")+1) ) { if($("#buffer").prop('checked')==true) {alert("Good job!");} else {alert("Please try again. What are the 2 components required in large excess to form a buffer?");} } if (get Float("p Y") < (get Float("p Ka")-1) || get Float("p Y") > (get Float("p Ka")+1)) { if($("#buffer").prop('checked')==false) {alert("Good job!");} else {alert("Please try again. What are the 2 components required in large excess to form a buffer?");} } } </script> <body> <ul> <li><a class="active" a href="index.html">Introduction</a></li> <li><a href="SASB.html">Strong Acid - Strong Base</a></li> <li><a href="SBSA.html">Strong Base - Strong Acid</a></li> <li><a href="WASB.html">Weak Acid - Strong Base</a></li> <li><a href="WBSA.html">Weak Base - Strong Acid</a></li> <li><a href="SBWA.html">Strong Base - Weak Acid</a></li> <li><a href="SAWB.html">Strong Acid - Weak Base</a></li> </ul> <div class="hover_img"> <p style="font-size:20px"><b>Titration Curve of Weak Acid against Strong Base</b> <a href="#">(image)<span><img src="WASB.png" height=500 border=2 ></span></a></p> </div> <table id='main Table' border=0 cellspacing=5 cellpadding=5> <tr><td><table cellpadding=5 width="20%"> <tr><td colspan=3 class='titlebg'>Set Titration Parameters</td></tr> <tr><td width="10%">[acid] = </td><td><input type='input' onchange='update Neutralisation()' class='inputbg box' size="10" id='aconc' value="1.00" /><br /><div id="acid Slider"></td><td>mol dm-3</td></tr> <tr><td>Ka (scientific notation) = </td><td><input type='input'class='inputbg box' size="10" id='Ka' value="1.80e-5" onchange='calculatep Ka(); update Neutralisation()' /></td><td>mol dm-3</td></tr> <tr><td>p Ka = </td><td><input type='input' class='box'size="10" id='p Ka' value="4.74" disabled /></td></tr> <tr><td>[base] = </td><td><input type='input' onchange='update Neutralisation()' class='inputbg box'size="10" id='bconc' value="1.00"/><br /><div id="base Slider"></td><td>mol dm-3</td></tr> <tr><td>Strong base is</td><td colspan=2><select id='btype' class='inputbg box' onchange='update Neutralisation()'> <option value=1>monoprotic</option> <option value=2>diprotic</option></select></td></tr> <tr><td>Vol of weak acid in conical flask</td><td><select id='avol' class='inputbg box' onchange="update Neutralisation();"> <option value=25>25.0</option> <option value=10>10.0</option></select></td><td>cm3</td></tr> <tr><td>Vol of strong base req for complete neutralisation</td><td><input type='input'class='box' size="10" id='bvol' value="25.00" disabled /></td><td>cm3</td></tr> <tr><td>Choice of indicator</td><td colspan=2><select id='indtype' class='inputbg box' onchange='change Chart Color(this.value)'> <option value='0'>no indicator</option> <option value='1'>methyl orange</option> <option value='2'>screened methyl orange</option> <option value='3'>phenolphthalein</option> <option value='4'>thymolphthalein</option></select></td></tr> <tr><td>Data points in increments of</td><td><select id='inc' class='inputbg box' value="1.00"> <option value=1.00>1.00</option> <option value=0.50>0.50</option> <option value=0.05>0.05 (1 drop)</option></select></td><td>cm3</td></tr> <tr><td colspan=3></td></tr> <tr><td>Stop titration at (for auto titration only)</td><td><input type='input' onchange='update Neutralisation()' class='inputbg box' size="10" id='stopt' value="50.00" /><br /><div id="stop TSlider"></td><td>cm3</td></tr> <tr><td colspan=3></td></tr> <tr> <td><input type='button' class='button greenbg' value="Do Titration Stepwise" onclick='titrate Step(); draw Chart()'></input></td> <td><input type='button' class='button redbg' value="Auto Titration" onclick='auto Titrate(); draw Chart()'></input></td> <td><input type='button' class='button' value="Reset" onclick='reset Titrate();'></input></td> </tr> </table></td> <td align=center><div id="chart_div"></div> <p class='titlebg'>Selected Point</p> Burette Volume <input type='input' class='box' size="6" id='p X' value="0.00" disabled /> p H <input type='input' class='box' size="6" id='p Y' value="0.00" disabled /><br> Select the major species present in the conical flask<br> <input type="checkbox" id="WA" value="0"> WA <input type="checkbox" id="BS" value="0"> conj base of WA <input type="checkbox" id="SB" value="0"> xs SB <input type="submit" value="Check" onclick='check Boxes()'><br> Is solution a buffer? <input type="checkbox" id="buffer" value="0"> yes <input type="submit" value="Check" onclick='check Buffer()'> </b> </td> <td> <div style='overflow:scroll; width: 200px; height:550px'> <table id="titable"> <thead><th>Burette Vol</th><th>p H</th><th>Tot Vol</th></thead> <tbody></tbody> </table> </div> </td> </tr> <html> <style type='text/css'> p {font-family: "Lucida Sans Unicode", "Lucida Grande", sans-serif; margin-top: 20px; margin-left:20px;} #main Table { width: 100%; font-family: "Lucida Sans Unicode", "Lucida Grande", sans-serif} #main Table td { vertical-align:top; font-size: 10pt; } .button { font-family: "Lucida Sans Unicode", "Lucida Grande", sans-serif; font-size: 120%; padding: 10px; width: 100% } .box { font-family: "Lucida Sans Unicode", "Lucida Grande", sans-serif; font-size: 100%; padding: 2px; } #titable th { padding: 5px; margin: 5px;} #titable td { text-align : center } .greenbg { background-color:66FF66 } .redbg { background-color:pink } .inputbg { background-color:FFFF00 } .titlebg { background-color:ccddff; font-weight: bold; line-height: 200%; text-align : center; padding: 5px; margin: 5px; width: 500px} #fx stop:nth-child(1){ stop-color: white; } #fx stop:nth-child(2){ stop-color: white; } #fx stop:nth-child(3){ stop-color: white; } ul {list-style-type: none;margin: 0;padding: 0;overflow: hidden;background-color: ccddff;} li {font-family: "Lucida Sans Unicode", "Lucida Grande", sans-serif; font-size: 80%; float: left;} li a, .dropbtn { display: inline-block; color: black; font-weight: bold; text-align: center; padding: 14px 16px; text-decoration: none; } li a:hover, .dropdown:hover .dropbtn {background-color: 99b3ff;} .hover_img a { position:relative;} .hover_img a span { position:absolute; display:none; z-index:99; background-color: ffffff; left:50%; -webkit-transform: translate X(-50%); -ms-transform: translate X(-50%); transform: translate X(-50%);} .hover_img a:hover span { display:block; } </style> <link rel="stylesheet" href="https://code.jquery.com/ui/1.11.4/themes/smoothness/jquery-ui.css"> <script src="https://ajax.googleapis.com/ajax/libs/jquery/2.2.2/jquery.min.js"></script> <script src="https://code.jquery.com/ui/1.11.4/jquery-ui.js"></script> <script src="https://rawgit.com/jmosbech/Sticky Table Headers/master/js/jquery.stickytableheaders.min.js"></script> <script type="text/javascript" src="https://www.gstatic.com/charts/loader.js"></script> <script type="text/javascript"> google.charts.load('current', {'packages':['corechart']}); // Load the Visualization API and the corechart package. google.charts.set On Load Callback(first Load); // Set a callback to run when the Google Visualization API is loaded. var burette Vol = 0; var init Mol = -1; var tot Vol = 0; function create SVG(n,a,b){ var xmlns = "http://www.w3.org/2000/svg"; var e = document.create Element NS (xmlns, n); for(var k in a){ e.set Attribute NS (null, k,a[k]); } for(var k in b){ e.set Attribute (k,b[k]); } return e; }; function first Load() { $(document).ready( function() { $("#titable tbody").html( $("#titable tbody").html() + "<tr><td>" + burette Vol.to Fixed(2) + "</td><td>" + calculate PH().to Fixed(2) + "</td><td>" + tot Vol.to Fixed(2) + "</td></tr>"); update Neutralisation(); $('#titable').sticky Table Headers({ scrollable Area: $('#titable').parent() , fixed Offset:-30 }); $( "#acid Slider" ).slider({ value:100, min: 5, max: 200, step: 5, slide: function( event, ui ) { set Float("aconc", ui.value / 100); }, stop: function( event, ui ) { update Neutralisation(); } }); $( "#base Slider" ).slider({ value:100, min: 5, max: 200, step: 5, slide: function( event, ui ) { set Float("bconc", ui.value / 100); }, stop: function( event, ui ) { update Neutralisation(); } }); $( "#stop TSlider" ).slider({ value:500, min: 10, max: 500, step: 10, slide: function( event, ui ) { set Float("stopt", ui.value / 10); } }); page Loaded = true; }); } function draw Chart() { // Create the data table. var data = new google.visualization.Data Table(); data.add Column('number', 'Volume'); data.add Column('number', 'p H'); var rows = $("#titable tbody tr"); for (i = 0; i < rows.length; i++) data.add Row([ parse Float($( rows[i] ).children()[0].inner HTML), parse Float( $( rows[i] ).children()[1].inner HTML ) ]); // Set chart options var options = { h Axis: { title: 'Volume of strong acid added / cm3', title Text Style: {color: '#FF0000', bold: 1, italic: 0, font Size: 20, font Name: 'Lucida Sans Unicode' }, view Window: { min: 0, max: 50 }, ticks: [0, 5, 10, 15, 20, 25, 30, 35, 40, 45, 50]}, v Axis: { title: 'p H', title Text Style: {color: '#FF0000', bold: 1, italic: 0, font Size: 20, font Name: 'Lucida Sans Unicode' }, view Window: { min: 0, max: 14 }, ticks: [0,1,2,3,4,5,6,7,8,9,10,11,12,13,14] }, 'chart Area': { top: 20 }, 'legend': {position: 'none'}, 'width':700, 'height':450, line Width: 3, colors: ['black'] }; // Instantiate and draw our chart, passing in some options. var chart = new google.visualization.Line Chart(document.get Element By Id('chart_div')); google.visualization.events.add Listener(chart, 'ready', function() { var gradient = create SVG('linear Gradient', {x1:0,y1:0, x2:0, y1:1}, {id:'fx'}); document.get Element By Id("chart_div").query Selector('svg>defs').append Child(gradient); gradient.append Child(create SVG('stop',{offset:'0%'})); gradient.append Child(create SVG('stop',{offset:'25%'})); gradient.append Child(create SVG('stop',{offset:'50%'})); gradient.append Child(create SVG('stop',{offset:'100%'})); $("svg").find("[clip-path]").parent().find("rect").first().attr("fill", "url(#fx)").attr("fill-opacity", "1"); change Chart Color($("#indtype").val()); }); function select Handler() { var selected Item = chart.get Selection()[0]; if (selected Item) { var p X = data.get Value(selected Item.row, 0).to Fixed(2); var p Y = data.get Value(selected Item.row, 1).to Fixed(2); $("#p X").val(p X); $("#p Y").val(p Y); } } google.visualization.events.add Listener(chart, 'select', select Handler); chart.draw(data, options) } function get Float(id) { return parse Float( $("#"+id).val() ); } function set Float(id, v) { $("#"+id).val( parse Float(v).to Fixed(2) ) ; } function calculatep Kb() { var x = (-Math.log10(get Float("Kb"))).to Fixed(2); $("#p Kb").val(x); if(get Float("p Kb")<2 || get Float("p Kb")>10) {alert("check Kb value, use scientific notation");} } function p HWB() { return 14 + Math.log10(Math.sqrt( get Float("Kb") * get Float("bconc") )); } function p HBB(conc B, conc S) { return 14 - (-Math.log10(get Float("Kb")) + (Math.log10(conc S/conc B))); } function p HWA(conc) { return -Math.log10(Math.sqrt(1e-14/get Float("Kb")*conc)); } function p HSA(conc) { return -Math.log10(conc) } function calculate PH() { if ( burette Vol.to Fixed(2) == 0 ) { return p HWB(); } else if (burette Vol.to Fixed(2) == get Float("avol").to Fixed(2) ) { return p HWA(init Mol/tot Vol); } else if (burette Vol < get Float("avol") ) { return p HBB( ( init Mol - burette Vol * get Float("aconc") * get Float("atype") ), (burette Vol * get Float("aconc") * get Float("atype")) ); } else if (burette Vol > get Float("avol") ) { return p HSA( ( burette Vol * get Float("aconc") * get Float("atype") - init Mol ) / (tot Vol) ); } } function init Vars() { init Mol = get Float("bconc") * get Float("bvol"); tot Vol = get Float("bvol"); burette Vol = 0; } function titrate Step() { if (init Mol == -1) init Vars(); burette Vol += get Float("inc"); tot Vol += get Float("inc"); $("#titable tbody").html( $("#titable tbody").html() + "<tr><td>" + burette Vol.to Fixed(2) + "</td><td>" + calculate PH().to Fixed(2) + "</td><td>" + tot Vol.to Fixed(2) + "</td></tr>"); $("#titable").parent().scroll Top( $("#titable").height() ) } function update Neutralisation() { $("#avol").val( ( ( get Float("bvol") * get Float("bconc") ) / ( get Float("atype") * get Float("aconc") ) ).to Fixed(2) ); if (get Float("avol") > 50) {alert("Titre volume cannot exceed maximum capacity of burette!");} else if (get Float("avol") < 15) {alert("Titre volume too small, leads to large percentage error!");} reset Titrate(); } function auto Titrate() { while ( burette Vol < get Float("stopt")) { titrate Step(); } } function reset Titrate() { $("#titable tbody").html( "" ) draw Chart(); init Vars(); $("#titable tbody").html( $("#titable tbody").html() + "<tr><td>" + burette Vol.to Fixed(2) + "</td><td>" + calculate PH().to Fixed(2) + "</td><td>" + tot Vol.to Fixed(2) + "</td></tr>"); } var chart Col = {'0': ["white", "white", "white", "white"], '1': ["red", "orange", "#ffff33", "#ffff33"], '2': ["#990099", "grey", "#009933", "#009933"], '3': ["white", "white", "white","fuchsia"], '4': ["white", "white", "white","#2c5ba5"], }; function change Chart Color(ind Type) { $("#fx stop:nth-child(1)").css("stop-color",chart Col[ind Type][0]) $("#fx stop:nth-child(2)").css("stop-color",chart Col[ind Type][1]) $("#fx stop:nth-child(3)").css("stop-color",chart Col[ind Type][2]) $("#fx stop:nth-child(4)").css("stop-color",chart Col[ind Type][3]) } function check Boxes() { if (get Float("p X") == 0 && $("#WB").prop('checked')==true && $("#AS").prop('checked')==false && $("#SA").prop('checked')==false) {alert("Good job!");} else if (get Float("p X") < get Float("avol") && get Float("p X") > 0 && $("#WB").prop('checked')==true && $("#AS").prop('checked')==true && $("#SA").prop('checked')==false) {alert("Good job!");} else if (get Float("p X") > get Float("avol") && $("#WB").prop('checked')==false && $("#AS").prop('checked')==true && $("#SA").prop('checked')==true) {alert("Good job!");} else if (get Float("p X") == get Float("avol") && $("#WB").prop('checked')==false && $("#AS").prop('checked')==true && $("#SA").prop('checked')==false) {alert("Good job!");} else {alert("Please try again.");} } function check Buffer() { if ( (14-get Float("p Y")) > (get Float("p Kb")-1) && (14-get Float("p Y")) < (get Float("p Kb")+1) ) { if($("#buffer").prop('checked')==true) {alert("Good job!");} else {alert("Please try again. What are the 2 components required in large excess to form a buffer?");} } else if ( (14-get Float("p Y")) < (get Float("p Kb")-1) || (14-get Float("p Y")) > (get Float("p Kb")+1) ) { if($("#buffer").prop('checked')==false) {alert("Good job!");} else {alert("Please try again. What are the 2 components required in large excess to form a buffer?");} } } </script> <body> <ul> <li><a class="active" a href="index.html">Introduction</a></li> <li><a href="SASB.html">Strong Acid - Strong Base</a></li> <li><a href="SBSA.html">Strong Base - Strong Acid</a></li> <li><a href="WASB.html">Weak Acid - Strong Base</a></li> <li><a href="WBSA.html">Weak Base - Strong Acid</a></li> <li><a href="SBWA.html">Strong Base - Weak Acid</a></li> <li><a href="SAWB.html">Strong Acid - Weak Base</a></li> </ul> <div class="hover_img"> <p style="font-size:20px"><b>Titration Curve of Weak Base against Strong Acid</b> <a href="#">(image)<span><img src="WBSA.png" height=500 border=2 ></span></a></p> </div> <table id='main Table' border=0 cellspacing=5 cellpadding=5> <tr><td><table cellpadding=5 width="20%"> <tr><td colspan=3 class='titlebg'>Set Titration Parameters</td></tr> <tr><td width="10%">[base] = </td><td><input type='input' onchange='update Neutralisation()' class='inputbg box' size="10" id='bconc' value="1.00" /><br /><div id="base Slider"></td><td>mol dm-3</td></tr> <tr><td>Kb (scientific notation) = </td><td><input type='input'class='inputbg box' size="10" id='Kb' value="1.80e-5" onchange='calculatep Kb(); update Neutralisation()' /></td><td>mol dm-3</td></tr> <tr><td>p Kb = </td><td><input type='input' class='box'size="10" id='p Kb' value="4.74" disabled /></td></tr> <tr><td>[acid] = </td><td><input type='input' onchange='update Neutralisation()' class='inputbg box'size="10" id='aconc' value="1.00"/><br /><div id="acid Slider"></td><td>mol dm-3</td></tr> <tr><td>Strong acid is</td><td colspan=2><select id='atype' class='inputbg box' onchange='update Neutralisation()'> <option value=1>monoprotic</option> <option value=2>diprotic</option></select></td></tr> <tr><td>Vol of weak base in conical flask</td><td><select id='bvol' class='inputbg box' onchange="update Neutralisation();"> <option value=25>25.0</option> <option value=10>10.0</option></select></td><td>cm3</td></tr> <tr><td>Vol of strong acid req for complete neutralisation</td><td><input type='input'class='box' size="10" id='avol' value="25.00" disabled /></td><td>cm3</td></tr> <tr><td>Choice of indicator</td><td colspan=2><select id='indtype' class='inputbg box' onchange='change Chart Color(this.value)'> <option value='0'>no indicator</option> <option value='1'>methyl orange</option> <option value='2'>screened methyl orange</option> <option value='3'>phenolphthalein</option> <option value='4'>thymolphthalein</option></select></td></tr> <tr><td>Data points in increments of</td><td><select id='inc' class='inputbg box' value="1.00"> <option value=1.00>1.00</option> <option value=0.50>0.50</option> <option value=0.05>0.05 (1 drop)</option></select></td><td>cm3</td></tr> <tr><td colspan=3></td></tr> <tr><td>Stop titration at (for auto titration only)</td><td><input type='input' onchange='update Neutralisation()' class='inputbg box' size="10" id='stopt' value="50.00" /><br /><div id="stop TSlider"></td><td>cm3</td></tr> <tr><td colspan=3></td></tr> <tr> <td><input type='button' class='button greenbg' value="Do Titration Stepwise" onclick='titrate Step(); draw Chart()'></input></td> <td><input type='button' class='button redbg' value="Auto Titration" onclick='auto Titrate(); draw Chart()'></input></td> <td><input type='button' class='button' value="Reset" onclick='reset Titrate();'></input></td> </tr> </table></td> <td align=center><div id="chart_div"></div> <p class='titlebg'>Selected Point</p> Burette Volume <input type='input' class='box' size="6" id='p X' value="0.00" disabled /> p H <input type='input' class='box' size="6" id='p Y' value="0.00" disabled /><br> Select the major species present in the conical flask<br> <input type="checkbox" id="WB" value="0"> WB <input type="checkbox" id="AS" value="0"> conj acid of WB <input type="checkbox" id="SA" value="0"> xs SA <input type="submit" value="Check" onclick='check Boxes()'><br> Is solution a buffer? <input type="checkbox" id="buffer" value="0"> yes <input type="submit" value="Check" onclick='check Buffer()'> </b> </td> <td> <div style='overflow:scroll; width: 200px; height:550px'> <table id="titable"> <thead><th>Burette Vol</th><th>p H</th><th>To?

2. Which approach best supports concept learning?

3. Why should only one variable be changed at a time?

4. What evidence should students include in their explanation?

5. What makes a good conclusion after using the model?

7. Learning Pulse

Anonymous activity shows this resource is being discovered, revisited, and used by learners in different places.

--currently viewing
--total page views

Where Recent Learners Are From

Country or region is inferred anonymously from server location headers when available. No names, accounts, or IP addresses are shown.

Detecting locations...
Updating anonymous page activity...