


About
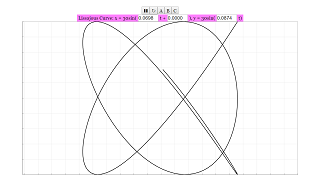
x = amplitude * cos ( frequency1 * time )
y = amplitude * cos ( frecuency2 * time + phase ) The shape of the curves are highly sensitive to the ratio frequency1/frequency2. Do experiment with different values of the frequencies and the phase using the fields provided in the simulation.
Dpto. de Informática y Automática
E.T.S. Ingeniería Informática, UNED
Juan del Rosal 16, 28040 Madrid, Spain
Translations
| Code | Language | Translator | Run | |
|---|---|---|---|---|
 |
||||
Software Requirements
| Android | iOS | Windows | MacOS | |
| with best with | Chrome | Chrome | Chrome | Chrome |
| support full-screen? | Yes. Chrome/Opera No. Firefox/ Samsung Internet | Not yet | Yes | Yes |
| cannot work on | some mobile browser that don't understand JavaScript such as..... | cannot work on Internet Explorer 9 and below |
Credits

Alfonso Urqua; Carla Martn; Tan Wei Chiong; Loo Kang Wee
end faq
Sample Learning Goals
[text]
For Teachers
Lissajous curves are a family of parametric curves studied by the French physicist and mathematician Jules Antoine Lissajous (1822 - 1880).
Lissajous curves are the composition of two harmonic motions (sinusoids):
x = amplitude * cos ( frequency1 * time )
y = amplitude * cos ( frecuency2 * time + phase )
The shape of the curves is highly sensitive to the ratio frequency1/frequency2.
There are 3 curves A, B, and C in this simulation, which is vastly different from each other. The amplitude of the curve is set to 30, but both frequencies and the phase can be changed.
Do experiment with different values of the frequencies and the phase using the fields provided in the simulation, and see how the graph changes.
Research
[text]
Video
[text]
Version:
- http://weelookang.blogspot.com/2018/05/lissajous-curves-javascript-simulation.html
- http://www.euclides.dia.uned.es/simulab-pfp/curso_online/cap7_caseStudies/leccion.htm by Alfonso Urquia and Carla Martin-Villalba
Other Resources
[text]
