


About
Geometric sequence and its series
The members of the geometric sequence follow the rule:
xi+1= xi*a
xi it the i-th member of the sequence, with index i a positive integer, including 0. The growth parameter a is real number. With
x0=1
the members are 1, a, a2, a3, a4..... xi =a i
The geometric series (sequence of partial sums) is generated by consecutive addition of the members of the geometric sequence: The partial sums are:
Si = Σoi a n with 0 ≤ n≤ i; Si = 1 + a + a 2....+a i
In the simulation you can vary parameter a by a slider in the range -1,05≤ a ≤+1,05 . Reset returns to the default value 0.5 .
The interesting issue is if the series will have a finite value (a limit, if the series is convergent) when the index grows unlimited, or if it goes to infinity (the series is divergent). This depends on a.
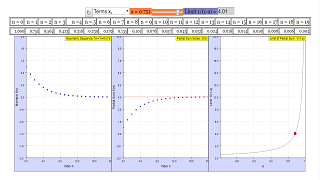
The left chart displays the members of the sequence, while the middle chart those of the partial sum series, both in dependence on the index n. On the right, the chart of the limit of the series of partial sums is shown in dependence on a, with a red point for its chosen value.
The values for each term can be viewed in the table above the graphs. You can toggle between viewing the individual terms of the sequence or the partial sum of the series using the combobox provided.
When a is smaller than 1 the geometric series of partial sums converges to
limitS i = 1 / (1-a) for abs(a) < 1
The graph in the right window displays this formula for the range-0.98 < a < 0.98
.
E1: Reset to a = 0.5
The partial sum series converges to 2.
How does the sequence evolve?
Try mentally to explain to a child how summing infinite finite numbers, none of which has a zero value, can lead to a finite value!
E2: Choose a around + 1
Obviously convergence of the partial sums needs a < 1.
What is the condition for the members of the sequence?
E3: Choose a < 1.
Compare sequence and series.
E4: Observe the red point in the limit window and compare with the series charts.
E4: Imagine: a = 0.5 . Now 10, 1000, 1000000 members of another sequence with increasing member value, whose respective sum is 50, 1000000, 1012 is added to the geometric series. Will the total sum be convergent? If yes, what is its limit?
E5: Which range of the index decides if an arbitrary series with finite members is convergent or not?
This file was created in August 2008 by Dieter Röß
This simulation is part of
“Learning and Teaching Mathematics using Simulations
– Plus 2000 Examples from Physics”
ISBN 978-3-11-025005-3, Walter de Gruyter GmbH & Co. KG
Translations
| Code | Language | Translator | Run | |
|---|---|---|---|---|
 |
||||
Software Requirements
| Android | iOS | Windows | MacOS | |
| with best with | Chrome | Chrome | Chrome | Chrome |
| support full-screen? | Yes. Chrome/Opera No. Firefox/ Samsung Internet | Not yet | Yes | Yes |
| cannot work on | some mobile browser that don't understand JavaScript such as..... | cannot work on Internet Explorer 9 and below |
Credits
 Dieter Roess - WEH- Foundation; Tan Wei Chiong; Loo Kang Wee
end faq
Sample Learning Goals
[text]
For Teachers
A geometric sequence is a number sequence of the form
where a is the first term of the sequence, and r is a constant, also called the common ratio.
On the other hand, a geometric series is written as the sum of the terms in the sequence as such:
where the terms of the sum continue indefinitely.
This simulation sets the first term of the sequence to be 1, and the common ratio in the simulation is denoted as a. From here on, a will denote the common ratio used in the simulation.
There are 3 graphs in the simulation. The leftmost graph plots the first 20 terms of the geometric sequence, the center graph plots the partial sum of those 20 terms, and the rightmost graph plots the limit of the series as the common ratio achanges.
The red arrow in the center graph denotes the limit of the partial sums as the number of terms approach infinity.
The common ratio, a, can be changed using the slider at the top of the simulation, and the field to the right of the slider displays the limit that the sum approaches (1/(1-a) for |a|<1).
The combo box allows you to toggle the array display between showing the terms of the sequence and the partial sums up to a certain term.
Research
[text]
Video
[text]
Version:
- http://weelookang.blogspot.sg/2016/02/vector-addition-b-c-model-with.html improved version with joseph chua's inputs
- http://weelookang.blogspot.sg/2014/10/vector-addition-model.html original simulation by lookang
Other Resources
[text]