
.png
)


About
Definite integral
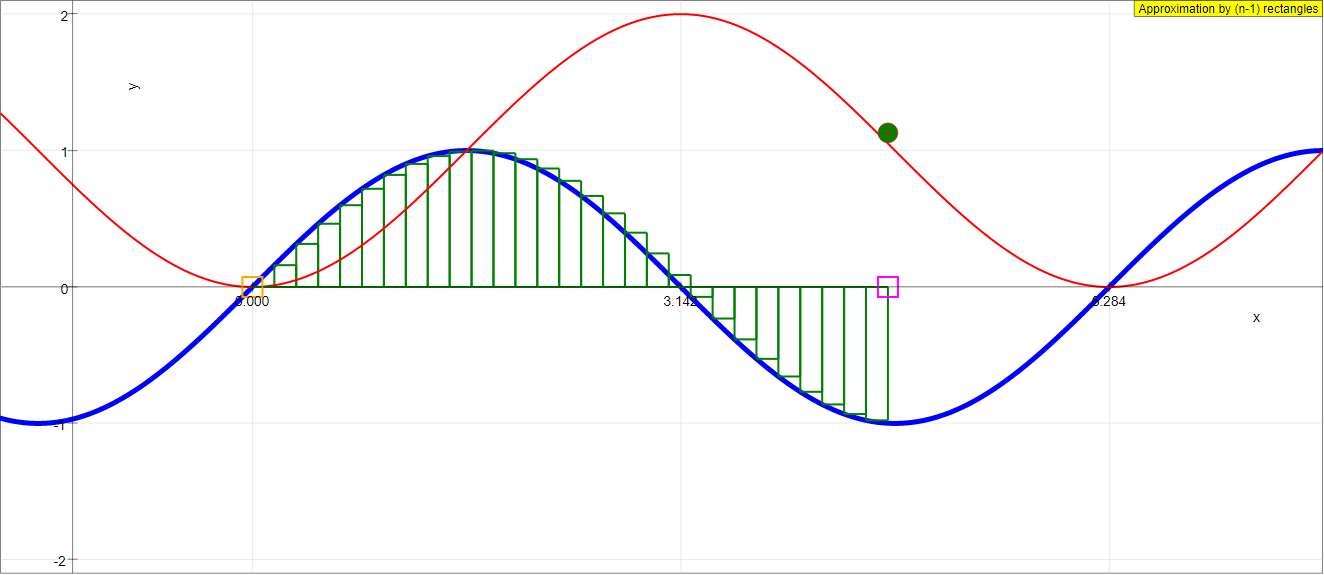
This simulation demonstrates definite integration of the sine function by the simple algorithm of summing approximative rectangles. The red curve shows the sine function itself.
The definite integral is to be calculated between initial point x1 (blue) an end point x2 (magenta). A first slider defines x1 ; x2 can be drawn with the mouse.
The red curve is the analytic antiderivative for an initial value x1: y = cos(x) - cos (x1).
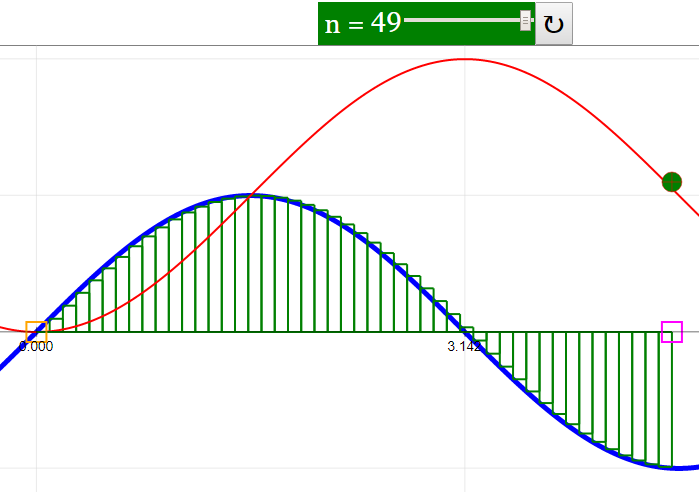
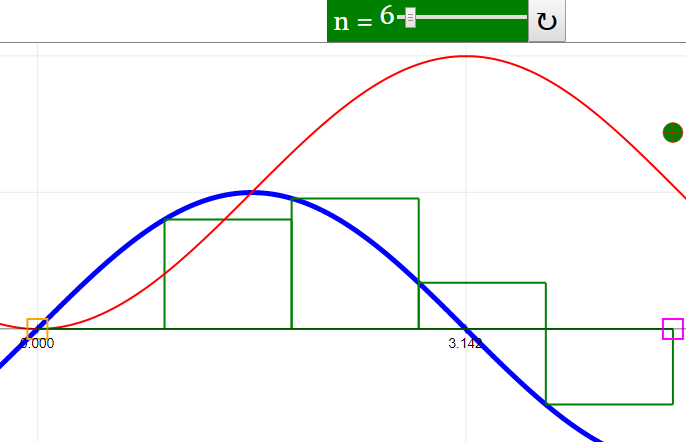
A second slider n defines the number n-1 of subinterval into which x2 - x1 is divided for the approximation. In each subinterval the approximative amplitude is assumed to be equal to its initial value. The sum of the area of all rectangles is shown by a green point at x2 .
Reset defines 1 < x < 4 and n-1 = 9.
E1: Start with the default setting: x1 = 0; n = 10.
Draw the magenta end point and observe the deviation of the rectangle sum (green point) from the analytic solution.
E2: Understand why the deviation is negative for x < π/2, and why it becomes zero at x = π . Reflect how summing mistakes can compensate for periodic functions.
E3: Increase the number of intervals with the slider and observe how the deviation changes and disappears in the limit.
E4: Change the initial point and consider why and how this shifts the analytic solution.
E5: Choose a large integration interval and consider why the rectangles lie below or above certain parts of the function.
Translations
| Code | Language | Translator | Run | |
|---|---|---|---|---|
 |
||||
Software Requirements
| Android | iOS | Windows | MacOS | |
| with best with | Chrome | Chrome | Chrome | Chrome |
| support full-screen? | Yes. Chrome/Opera No. Firefox/ Samsung Internet | Not yet | Yes | Yes |
| cannot work on | some mobile browser that don't understand JavaScript such as..... | cannot work on Internet Explorer 9 and below |
Credits
 Dieter Roess - WEH-Foundation; Fremont Teng; Loo Kang Wee
end faq
Sample Learning Goals
[text]
For Teachers
Definite Integral JavaScript Simulation Applet HTML5
Instructions
N Slider

Draggable Boxes

Toggling Full Screen
Reset Button

Research
[text]
Video
[text]
Version:
Other Resources
[text]