
.png
)


About
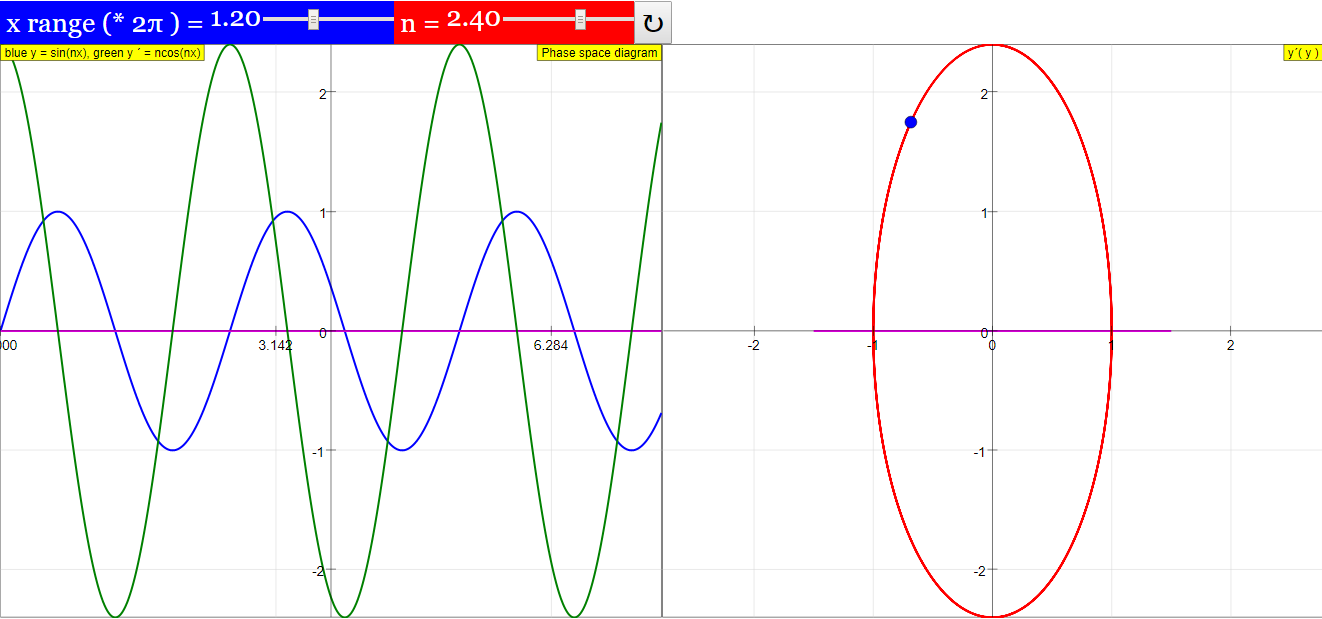
Phase space diagram
Phase space characterizes the interdependence of the variables and their derivatives in a given function y = y(x), for example y = y (x, y´,y´´). 2 dimensional phase space diagrams are projections of phase space onto a plane, as y = y (y´) or y´= y´(y´´). In 3D visualizations the projection can be spatial as in y = y( y´,y´´).
Phase space projections often characterize a function very evidently. In this simple simulation this is demonstrated for the periodicity of the sine function.
The left window shows the function y = sin (n x) itself in blue, its first derivative y´= ncos (nx) in green. The zero line is in magenta. With the slider n you can change the parameter n, which defines the number of periods in an x interval of 2π. Reset defines n = 1.
A second slider x range defines the range of x in the left window between 0.1 and 5 times 2π. Default value is 0.5, limiting the range of the function to one half period.
The right window shows the phase projection y´(y) in red. A blue point characterizes the relation y´(y) at the end of the x range. At default (n = 1 and xrange/2π=0.5) the phase space diagram is a half circle, corresponding to a half period of the function within the xrange. When xrange/2π is decreased, the phase space curve will contract. xrange/2π=1.0 leads to a full circle.
With n ≠ 1 the derivative has an amplitude n times that of the function. Correspondingly the phase diagram becomes an ellipse with an elongation of n. It has as many revolutions as the function has periods in the interval.
Periodicity is characterized by a closed space phase diagram with as many cycles as the function has periods.
Translations
| Code | Language | Translator | Run | |
|---|---|---|---|---|
 |
||||
Software Requirements
| Android | iOS | Windows | MacOS | |
| with best with | Chrome | Chrome | Chrome | Chrome |
| support full-screen? | Yes. Chrome/Opera No. Firefox/ Samsung Internet | Not yet | Yes | Yes |
| cannot work on | some mobile browser that don't understand JavaScript such as..... | cannot work on Internet Explorer 9 and below |
Credits
 Dieter Roess - WEH- Foundation; Fremont Teng; Loo Kang Wee
end faq
Sample Learning Goals
[text]
For Teachers
Phase Space Diagram JavaScript Simulation Applet HTML5
Instructions
x-range and n Sliders
Toggling Full Screen
Reset Button

Research
[text]
Video
[text]
Version:
Other Resources
[text]
