


About
This simulation illustrates the concept of a limit cycle by using the following mathematical model:
dx/dt = y + [K*x*(1 - x^2 - y^2)]/sqrt(x^2 + y^2)
dy/dt = -x + [K*y*(1 - x^2 - y^2)]/sqrt(x^2 + y^2)
The initial conditions are as follows:
x(0) = x0
y(0) = y0
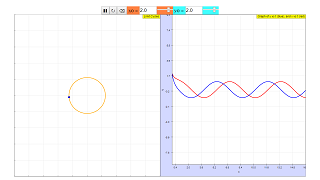
The limit cycle of this function is a circle centered at the origin with radius 1 (the unit circle), which can be expressed in the following statement.
For all x0,y0 (where x0, y0 are non-zero), x^2 + y^2 approaches 1 as t tends to infinity.
Dpto. de Informática y Automática
E.T.S. Ingeniería Informática, UNED
Juan del Rosal 16, 28040 Madrid, Spain
Translations
| Code | Language | Translator | Run | |
|---|---|---|---|---|
 |
||||
Software Requirements
| Android | iOS | Windows | MacOS | |
| with best with | Chrome | Chrome | Chrome | Chrome |
| support full-screen? | Yes. Chrome/Opera No. Firefox/ Samsung Internet | Not yet | Yes | Yes |
| cannot work on | some mobile browser that don't understand JavaScript such as..... | cannot work on Internet Explorer 9 and below |
Credits
 Alfonso Urquía; Carla Martín; Tan Wei Chiong; Loo Kang Wee
end faq
Sample Learning Goals
[text]
For Teachers
This simulation illustrates the concept of a limit cycle by using the following mathematical model:
dx/dt = y + [K*x*(1 - x^2 - y^2)]/sqrt(x^2 + y^2)
dy/dt = -x + [K*y*(1 - x^2 - y^2)]/sqrt(x^2 + y^2)
The initial conditions are as follows:
x(0) = x0
y(0) = y0
The limit cycle of this function is a circle centered at the origin with radius 1 (the unit circle), which can be expressed in the following statement.
For all x0,y0 (where x0, y0 are non-zero), x^2 + y^2 approaches 1 as t tends to infinity.
In essence, for any point on the Cartesian plane, it will eventually approach the limit of the unit circle, no matter where the point is.
The graph on the left illustrates the path of the point, while the graph on the right illustrates the graph of y against t (blue) and x against t (red).
Research
[text]
Video
[text]
Version:
- http://weelookang.blogspot.com/2018/05/limit-cycle-javascript-simulation.html
- http://www.euclides.dia.uned.es/simulab-pfp/curso_online/cap7_caseStudies/leccion.htm by Alfonso Urquia and Carla Martin-Villalba
Other Resources
[text]
