http://weelookang.blogspot.sg/2011/05/workshop-on-learning-physics-of-sport.html
Lee T.L., Wee, L. K. (2011, 19 January) workshop on investigation of the kinematics of a falling ball through Video Analysis and Modeling , 3rd Instructional Program Support Group (IPSG) Physics, Anglo-Chinese Junior College, Singapore
recently Tat Leong email the worksheet
https://docs.google.com/document/pub?id=1Qj4XBLEDT4jd-BH9KI80Fk4A-DVz46NGzzFG0SGOGF0
video can be doanloaded here http://www3.science.tamu.edu/cmse/videoanalysis/balldropbounce4x.avi
http://www3.science.tamu.edu/cmse/videoanalysis/ by Joel A. Bryan
not sure why the embed code result in a small window
Workshop to investigate the kinematics of a falling ball , Anglo-Chinese Junior College, Singapore by Lee T.L., Wee, L. K. (2011, 19 January)
Workshop on Learning Physics of Sport Science through Video Analysis and Modeling, Anglo-Chinese Junior College, Singapore by Lee T.L., Wee, L. K. (2011, 19 January)
recently Tat Leong email the worksheet
https://docs.google.com/document/pub?id=1Qj4XBLEDT4jd-BH9KI80Fk4A-DVz46NGzzFG0SGOGF0
Background:
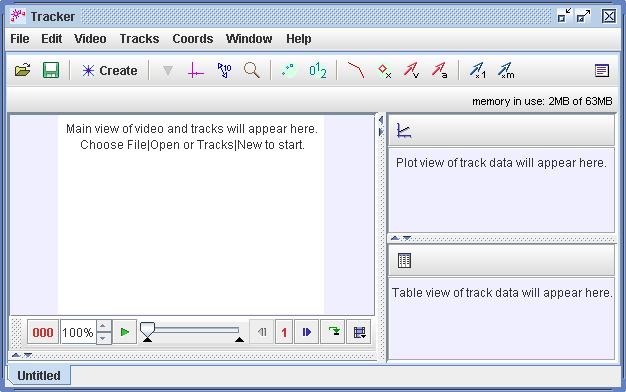
Procedure:
-
Click the Open button
-
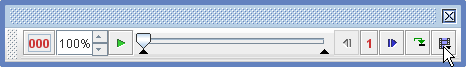
Select the display of the clip settings by clicking the clip settings button at the bottom right end of the player as shown.

-
Set the reference frame origin and angle. Click the Axes button .
-
To calibrate the scale on the video, click the Tape Measure button
-
The ball maybe difficult to detect due to the quality of the frames, select the Video–Filters-Deinterlace-Even and close it after selection. This step may increase the visibility of the ball.
-
If tracking an object, mark its position on every frame by holding down the shift key and clicking the mouse (crosshair cursor) as the video automatically steps through the video clip. Note: don't skip frames--if you do, velocities and accelerations cannot be determined. Track the ball until end of frame. Plot and analyze the tracks The Plot View displays graphs of track data. To plot multiple graphs, click the Plots button and select the desired (3) plots number. Click the x- or y-axis label to change the variable plotted on that axis. In this video, choose y versus t, vy versus t & ay versus t.
-
Right-click on a plot (y versus t) to access display and analysis options in a popup menu. Select the various options as shown in the figure.
-
Select points you want to perform a curve fit. For this exercise,
-
select “Parabola” Fit Equation of the form y = a*t^2 + b*t + c,
-
select “Autofit”,
-
take a look at the parameters and values
-
-
Repeat Steps 9 to 11 for plot (vy versus t) and use the “Linear” Fit Equation y = a*t + b
-
Right click on the plot of vy versus t and select Analyze-Area and select by click and drag the 2 grey vertical boundaries to select the area to measure for the duration of start of motion to the start of 1st bound of the ball. Calculate the area under a velocity-time graph.
Drag the grey lines
-
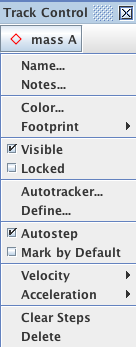
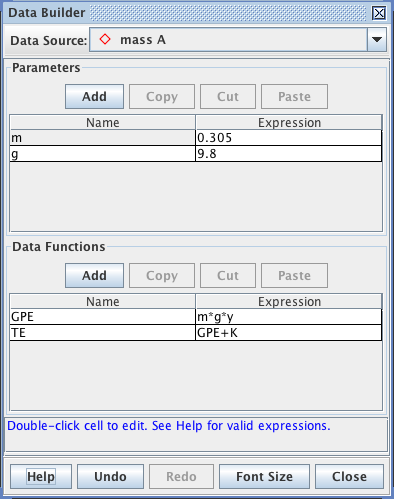
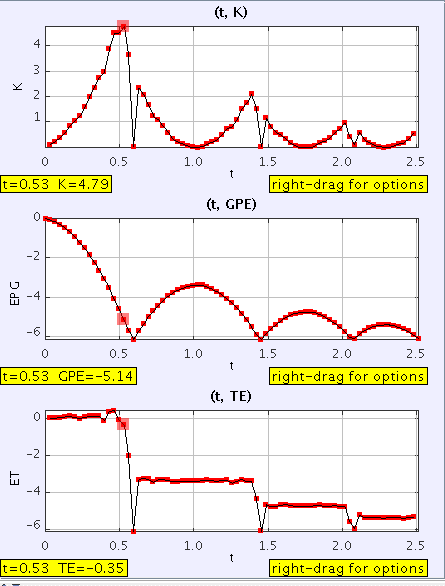
Define potential energy, and total energy, via “data builder” (access through “Track Control”).
* * *

 * * |
 * * |
 * * |