Final Report Project Title
Learning Tools Interoperability (LTI) Exploratory Learning Environment (ELE) Data Analytics
Shortened Title:
Simulation-Games Data Analytics for Student Learning Space
Project Team
Principal Investigator:
Lawrence Wee Loo Kang (Lead Specialist)
Co-Principal Investigators:
Darren Tan (Senior Specialist)
Gerald Ajam (Senior Specialist)
Interactive simulations from the Open Source Physics (Christian & Esquembre, 2012; Esquembre, 2004) at Singapore (OSP@SG) project's exploratory learning environment (ELE, another name for virtual laboratory) have been used in many online lessons hosted on the Student Learning Space (SLS). These simulations facilitate inquiry (Aloysius Goh, Wee, Yip, Jeffrey Toh, & Lye, 2013) (e.g. for physics and other sciences) and gamification (e.g. for maths and languages) as students complete learning tasks online on a simulation.
We have successfully developed a functional ELE data analytics prototype (\(XXK via SSTRF instead of a native SLS built estimated at \)X00K) that tracks and reports ELE interactions (e.g. correct/incorrect “responses”, actions on buttons and sliders with time stamp). Several learning analytics (LA) indicators were discussed in “Findings” with supporting features built that made the project also grounded on learning analytics knowledge base. We made use of these LA indicators and designed the prototype working with both SLS sandbox (for potential external app suppliers to test) and development (for SLS vendor to develop new code for newer SLS releases) servers.
We are currently gathering support from CPDD Science Branch Head to “support” the adding of the project into the production server of SLS from which, all Singapore teachers and students can benefit from this projects’ 25 data-analytics-enabled simulations.
The project has successfully achieved the 3 goals and they are:
- Glean learning difficulties while students are using our OSP@SG virtual laboratories/ELE-games. For example, in one of the simulations, we display what the student clicked on the combo-box “3” while the correct answer is “6”, suggesting a learning-performance difficulty in estimating the number of paper clips used to measure the length of a pencil

Figure 1: An example of Question 1 where student clicked on “3” in the simulation, while the correct answer is “6”, suggesting a learning-performance difficulty in estimating the number of paper clips used to measure the length of a pencil
- We developed our teacher dashboard that adopts the current SLS “Monitor Assignment” display (so that teachers can depend on their existing knowledge of SLS and understand our Monitor Assignment page) and evolved our teacher dashboard to facilitate insights and data-informed teaching actions. For example, we added additional display on the header below the question number, that shows the percentage of wrongs for each question, to relief the teacher of the need to scroll up and down manually to gauge how many students got the question incorrect so that the teacher can decide to discuss the question in class as a large group class activity.
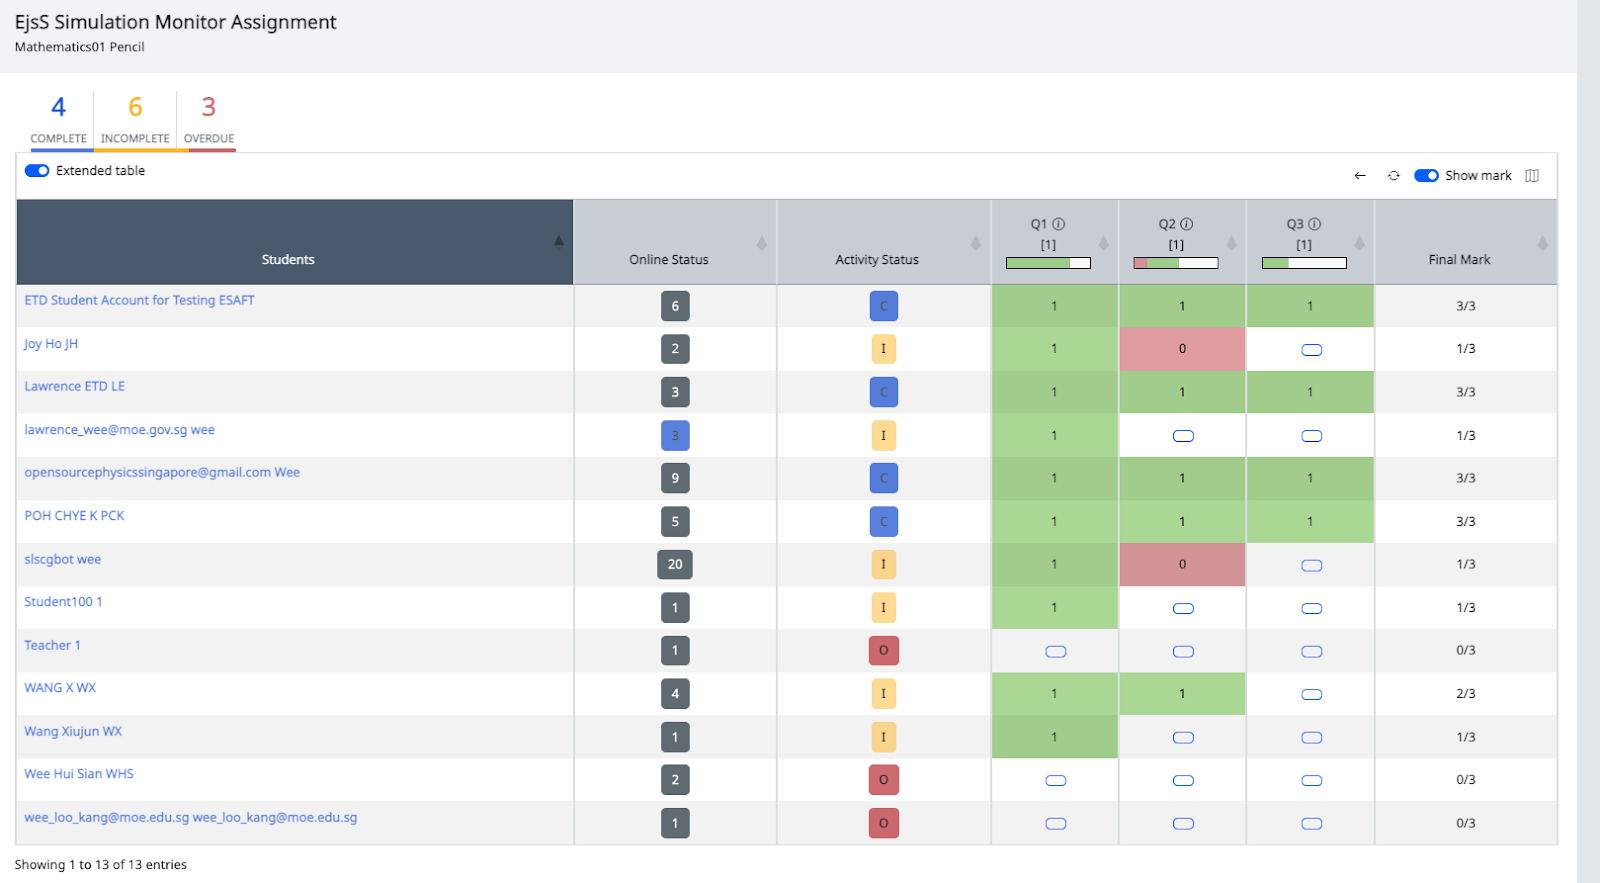
Figure 2: A Simulation Monitor Assignment page showing 3 questions-tasks, 1 mark for correct answer, 0 for incorrect and mouse over the mark for detailed history (correct and wrong with explanations)
- The 2 teachers in our user testing gave their qualitative feedback that were positive. We have some evidence that suggests this project can be used by teachers to support them in identifying data informed students’ performance-learning difficulties and possible misconceptions.
We have continued to work on both improving as well as adding new simulations with CPDD officers and their initial feedback is encouraging.
Purpose
- Enhance teaching and learning practices by examining correct and wrong choices made by students while performing tasks or questions using OSP@SG/Easy JavaScript Simulation (EJSS) virtual laboratories/ELE-games.
- Experiment with what visualisation of student-user data and representation (example teacher dashboard of tasks building on SLS existing Assignment monitoring dashboard, their actions, etc) will provide better support for teachers to facilitate teaching and learning with EJSS ELE-interactives.
- Understand via a user testing research method to see how teachers and students can benefit from the data analytics provided by such a platform, in terms of adapting instructions.
Method
Tool Development
The research purpose is to enrich learning and teaching practices by displaying a meaningful set of ELE data for better feedback and guidance through ELE/simulation data analytics. To realise this research, we need to build a LTI tool provider (Moodle was decided to be used for ease of scalability with SLS and other future LTI compliance learning management system) that serves the LTI tool consumer (SLS) through OAuth signatures validated messages.
The foundation and technical research on LTI tool provider-consumer will tap on our trainer Professor Felix to create the prototype solution and to train project team members to contribute to the solution’s GitLab source code. The data needed for technical analytics are SLS teacher’s classroom context for limiting the student data display, server logs of students’ usage data and expert scans to look out for start and end of each tasks-questions for the assignment of marks and interaction history log.
User testing
A design-based approach with an iterative cycle of development-implementation-evaluation on the technology tool via user testing involving ETD officers and teachers is appropriate in this SSTRF. Students are excluded from the project due to safety considering the ongoing COVID-19 pandemic.
The data needed for user research are semi structured interviews while interacting with each simulation real-time, to get teachers comfortable to reveal their deep thoughts and feelings (verbal as well as the SLS interactive thinking tool on the development SLS server were used). This has helped the project to distil useful principles and features such as having incorrect and correct choices displayed together to ease data visualization.
Participants
The sample size targeted is 2 teachers that came to ETD-SLS on teacher work attachment. These Math and Chinese teachers enabled the collection of varied teachers’ needs and supported the development of interactive and games to meet their students’ needs.
MOE Senior Specialists and SLS and CPDD team members were consulted terms of relevant data to collect, analyse and present, the visual design of analysed data (e.g. bar vs pie).
Findings
Achieve more with less fund
This project significantly expands the Key Application of Technology “KAT- Monitoring” capabilities of SLS with simulations without extensive development costs as core build of SLS. We argue that our project has freed up development funds for other core SLS build as well as shown a more sustainable approach to having data analytics enabled simulation by tapping on external Open Source Physics community to create new simulations and features.
Table 1 is a quick summary of the compelling reasons that continue to resonate after the completion of this SSTRF project over a SLS native-core build. Cost of building this is estimated 26% less than SLS native build, with lower subscription fees that are only a miniscule fraction of SLS costs (3%).
|
SSTRF |
SLS core build |
|
|
Upfront development cost |
\( X0,000 |
Estimated at \)X00,000 or more |
|
Subscription per year |
\(650 for web server and domain name \)0 for any number of students |
Estimated at \( X0,000 or more based on the number of students in SLS. |
|
Sustainability |
Open Source Physics (OSP) community who upgrades the system through other research grants usually at zero cost to MOE |
SLS vendor with likely costly upgrades |
Table 1: Comparison of SSTRF and SLS component core build with cost analysis
Learning analytics (LA) indicators/dimensions and how they will help with teaching and learning
These LA indicators were added into the proposal as suggested by the reviewers with relevant findings discussed in the table.
|
LA indicators |
Data collected |
|
Related to student’s thought process |
Steps taken by students leading to an erroneous response.
How many simulation steps before getting the answer to the task correct.
Tracking change of simulation parameters.
|
|
Related to student’s behaviour |
Active/inactive time.
|
|
Related to student’s engagement |
Number of simulation visits.
Supporting reattempts to motivate retries.
|
|
Related to using data quickly to detect which questions many students got the answers wrong |
Bar to show percentage of students who got the answers wrong.
|
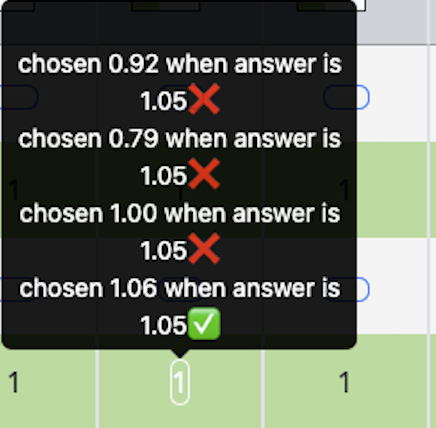
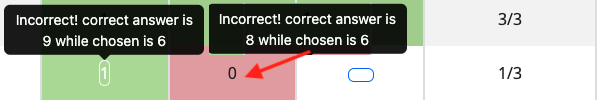

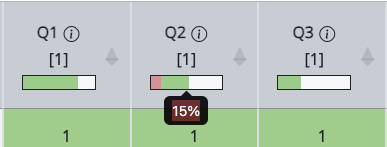
Table 2: Specific learning analytics indicators/dimensions and how they might help with teaching and learning
Positive Feedback from teachers
We include the 2 teachers’ interview feedback as findings that support the projects’ successful completion with the potential usefulness (in bold).
Teacher A:
“Data derived from simulations will help the teacher to understand how a student thinks, at which juncture the student is stuck at. Hence, with time, the data generated with a bigger pool of students may be useful to predict if there are common misconceptions or error points that students in general will face difficulties in while doing simulations.
As a teacher, I see the value of using simulations in the teaching and learning of my students. This is because a simulation-based education provides ample opportunities for my students to practise learned skills in real-life situations. They will be involved in scenarios where they must actively solve problems and put their understanding of the concepts and knowledge, together with skill sets to use. This mode of experiential practice helps to promote concept attainment and is more engaging to the students, for they experience the activity first-hand, rather than merely hearing or seeing it. In addition, I believe that my students will be more empowered and willing to explore “What-Ifs” questions or scenarios because they get to interact with the simulations repetitively. Furthermore, students’ autonomy of learning is encouraged as they get to commit mistakes in a safe environment, without being judged. Most importantly, through a simulation-based education, students get to spot the patterns, make predictions, and explain the outcome they expect the simulation to generate.”
Teacher B:
“The simulations provide alternative pathways (instead of the usual reading and watching videos) for students to make sense of what they are learning by allowing them to interact with the contents to form meaningful connections which would be helpful in internalising the knowledge.
The analytics built into the simulations give teachers a glimpse of how students have interacted with the simulations. This will allow teachers to better scaffold students’ learning, such as asking more targeted questions to help students identify the gaps in their learning, or asking higher order thinking questions, to get students to think deeper and explain their observations.”
Dissemination
We will be sharing our project’s findings at 15th A Level Physics IPSG Symposium and MOE Research Forum 2023.
To further encourage adoption of the tools and resources developed, we have opened our Moodle installation with the simulation data analytics to support “non-editing teachers” and “students” roles for interested MOE educators to try out the project. Refer to this for the self-registration process. This may help in the spread of the project’s artefacts and research as more people become aware of its ease of adding into any SLS lessons estimated to be available by June of 2023.
We have also drafted 4 set of documentation to help MOE scale up this research capability for any other Moodle installation.
Assuming Moodle 4.0 is used as the LTI provider, these documents will help to support any Moodle 4.0 installation to have the data analytics capabilities and serve the SLS (development, sandbox and production) servers:
- Installation steps and configuration of LA EjsS Moodle plugin
- Patching Moodle 4.0 to allow integration with SLS
- Integration [patchedhttps://docs.google.com/document/d/1za4P4tivPXzLOTdf9N2apCAMUWMZbqJX/edit">Monitoring of EjsS Simulations in SLS
We also created a YouTube playlist of tutorials to explain how the various components of the project work.
Application
We have successfully deployed the Moodle (LTI provider) project into the Development and the Sandbox server of SLS. We are in the process of applying for approval to be deployed in the production server of SLS, via SLS Project Team and DET’s approval in 2023.
Currently, a total of 25 simulations have been developed and added with the capabilities for data analytics. The number of simulations created demonstrates the project’s ability to scale up to meet the demands of different teachers and students taking different subjects at different levels.
We have developed 2 O Level Chemistry, 4 Primary Mathematics, 7 O and A Level Physics, 8 Primary Science, 1 NT Level Science, 1 O Level Biology simulation and 2 Mother Tongue games (1 Malay and 1 Chinese). These simulations can be used currently on both development and sandbox SLS environments. Alternatively, the Moodle server (LTI provider) itself can also be used to demonstrate this projects’ outcomes.
In middle of 2023, these simulations, subjected to ETD’s management approval, will be available for all SLS once it is deployed in production.
The listing with hyperlinks below provides quick access to the respective simulations.
- Chemistry01 Balance Equations
- Chemistry02 Rate of Reaction
- Mathematics01 Pencil
- Mathematics02 Weighing Scale
- Mathematics03 Riddle Game by Gerald
- Mathematics04 Clock 5 mins
- Physics01 Wave
- Physics02 Ball and Spring Stiffness
- Physics03 Standing Waves and Harmonics
- Physics04 Vector Quiz
- Physics05 Vernier Calliper cm
- Physics06 Micrometer Manual Version
- Physics07 Collision Quiz by Darren
- Science01 Life Cycle
- Science02 States of Matter Flow-chart
- Science03 Photosynthesis
- Science04 Water Evaporation Rate Experiment
- Science05 Light and Shadows
- Science06 Heat Transfer
- Science07 States of Matter Particle Sim
- Science08 Electromagnetism Experiment
- NTScience01 AC/DC Usage Example
- Biology01 Plant Transpiration Experiment
- MotherTongue Malay01 Kata Seerti (Malay Synonyms)
MotherTongue Chinese01 Catching Apple Game
Reflection
Was there any significant change in the research compared with the original proposal?
No student participants
Putting students at risk of COVID-19 exposure by arranging lesson trials in person classroom was difficult to justify. Thus, we decided to test internally with MOE-HQ officers and the Teacher Work Attachment Plus (TWA+) teachers that came to ETD for attachment in Oct-Nov 2022.
EJSS type 2 app not in SLS production yet
Making the EJSS app available in the production server of SLS so that students can easily use the apps requires both the SLS project team support before any Type 2 App can be deployed. This approval can only be given after the app is developed, which is Sept-Oct 2022.
Did the research proceed as expected and on time?
No. The project was originally scheduled to be conducted in 2021 but COVID-19 prevented the project from proceeding in 2021.
Were there any circumstances which aided or impeded the progress of the research?
Yes. Approval for trainer to come to Singapore
Thanks to support from ETD, the trainer was able to come to Singapore to work on the project in a face-to-face setting and helped the project to achieve its goal. It would have been difficult and slow with only 20 working days to overcome the difficulties of integrating with SLS.
What are your key learning points from the project?
SSTRF are useful projects for SS to achieve more with less funds than traditional MOE workstreams
We learned that this project was able to support building of SLS App tool at a fraction of the cost than built natively as SLS core features. We also believe this tool can be more easily sustained than by the vendor as simulations data analytics are niche competencies of the international Open Source Physics researcher-community that the vendor may not be able to produce in 20 working days.
Learning analytics indicators/dimensions and how they will help with teaching and learning
Building on existing literature on LA indicators helped to push the boundaries of our simulation data analytics. We would like to thank the reviewers for suggesting linking up with existing research on LA to support use of a common set of “terms” to strengthen the project’s communication.
Positive Teachers’ feedback
Officially, we have tested the project’s apps with 2 TWA+ teachers but unofficially, we also tested with a couple more MOE HQ officers in ETD. The 2 teachers’ feedback is aligned with what the other people we worked with to improve the project’s artefacts. We have evidence that the teachers wanted this kind of data that is easy to understand that builds on SLS existing “Monitor Assignment page”. This is because teachers don't have to relearn a different teacher dashboard of students’ action on the simulations.
Other comments/thoughts.
This is a “Research for Doing”, that aims to improve education policies (using SLS through external Apps at lower costs and more easily sustainable) and improve the monitoring of student learning in the context of simulation. The project has further pushed the boundaries of simulation with data analytics (Johnson et al., 2012) (we are not aware of any other family of simulations that is able to provide data analytics for SLS).
We will further co-create more simulations and use cases with teachers and students as well as rally other SSs interested in using our project artefacts after the completion of the project.
Reference:
Aloysius Goh, K. S., Wee, L. K., Yip, K. W., Jeffrey Toh, P. Y., & Lye, S. Y. (2013). Addressing learning difficulties in Newtons 1st and 3rd Laws through problem based inquiry using Easy Java Simulation. Paper presented at the 5th Redesign Pedagogy, Singapore. http://arxiv.org/ftp/arxiv/papers/1303/1303.0081.pdf
Christian, W., & Esquembre, F. (2012, Jul 04, 2011 - Jul 06, 2011). Computational Modeling with Open Source Physics and Easy Java Simulations. Paper presented at the South African National Institute for Theoretical Physics Event, University of Pretoria, South Africa.
Esquembre, F. (2004). Easy Java Simulations: A software tool to create scientific simulations in Java. Computer Physics Communications, 156(2), 199-204. Retrieved from http://www.scopus.com/inward/record.url?eid=2-s2.0-0347355062&partnerID=40&md5=ed9d02c552ba392972aa7dc36511e5cf
http://155.69.5.185:3210/sfxlcl3?genre=article&isbn=&issn=00104655&title=Computer+Physics+Communications&volume=156&issue=2&date=20040101&atitle=Easy+Java+Simulations%3a+a+software+tool+to+create+scientific+simulations+in+Java.&aulast=Esquembre%2c+Francisco&spage=199&sid=EBSCO:Academic+Search+Premier&pid=
Johnson, L., Adams, S., Becker, S., Ludgate, H., Cummins, M., & Estrada, V. (2012). Technology Outlook for Singaporean K-12 Education 2012-2017: An NMC Horizon Project Regional Analysis (978-0-9883762-2-9). Retrieved from Austin, Texas:
Proposal Aim
The Senior Specialist Track Research Fund (SSTRF) aims to build a culture of research in MOE and support the growth of Senior Specialists as thought leaders through providing opportunities for:
Leading and participating in research projects
Engaging in cross-divisional research collaborations
Communicating research findings and experiences
Informing policy and practice through research
Title:
Learning Tools Interoperability(LTI) Exploratory Learning Environment(ELE) Data Analytics
Abstract
Interactive simulations from the Open Source Physics at Singapore (OSP@SG) project's exploratory learning environment (ELE) has been used in several online lessons hosted on the Student Learning Space (SLS). These simulations facilitate inquiry (e.g. in physics, science) and gamification (math and languages) as students complete learning tasks online. With 4000 user referrals from the SLS in May 2020, the data on students’ mouse clicks and simulation states can be harnessed as learning analytics to better support teachers in monitoring and providing more personalised feedback for quality online ELE activities. Creating such a flexible ELE provider that can track and report ELE interactions (e.g. actions on buttons, time, duration) to teachers and resource creators would be research and development that can impact on teaching practice.
This study has three aims:
- Glean student difficulties by clickstream analytics while they are using any OSP@SG virtual laboratories/ELE-games by designing a Learning Tools Interoperability (LTI) provider on our multi-award winning ELE library.
- Test out what visualization and interpretation of these collected data on students’ actions via the ELE can be presented in a teacher dashboard for data informed teaching actions, transforming user data into teaching and learning insights
- Use a design based research approach to examine how teachers and students benefit from the data provided by such a platform, in terms of adapting instructions and enriching learning experiences.
Objective
Enhance teaching and learning practice by gleaning difficulties faced by students while using any OSP@SG/Easy JavaScript Simulation (EJSS) virtual laboratories/ELE-games
(In order to attain this objective, we need to first create a LTI tool provider for the entire 600 plus ELE to work on the SLS platform securely with OAuth signatures)
Experiment with what visualization of student-user data and representation (example scripted video playback, time stamp of actions, etc) will provide better support for teachers to facilitate ELE-simulation teaching and learning, in the context of EJSS ELE-interactives
Understand via a design based research method how teachers and students can benefit from the data analytics provided by such a platform, in terms of adapting instructions and enriching learning experiences
Research Questions
- RQ1: How can teaching and learning practices be enhanced and data informed while using any OSP@SG/Easy JavaScript Simulation (EJSS) virtual laboratories/ELE-games in the Student Learning Space (SLS) via LTI tool provider?
- RQ2: What visualizations of interaction and state data on the teacher dashboard are useful to provide better feedback and to enrich learning and teaching practices through ELE/simulation data analytics?
- RQ3: What are the ways in which teachers can improve their instruction, and students can benefit from learning through an ELE with the provision of such learning analytics?
Impetus for Research
Big Picture
There is significant potential in exploratory learning environments (ELEs) for teaching and learning (T&L), particularly in the development of 21st century competencies (21CC), to support learning experiences that promote self-directedness, critical thinking and collaboration. In addition, ELEs can also facilitate ubiquitous, unobtrusive and game-based assessment modes. Supporting the curriculum triangle of content, pedagogy and assessment across the whole instructional cycle in such ELEs will allow us to work towards AI-enabled ELEs. This is a possible area of deep research for MOE’s AI Use Case on Learning Companion.
Impetus for Research
The impetus for this research stems from:
1) Demand from teachers to monitor and guide students’ ELE-simulation activities
(Figure 1)
2) Rich source of interaction data from 4000 users per month referral from the SLS to the OSP@SG digital library
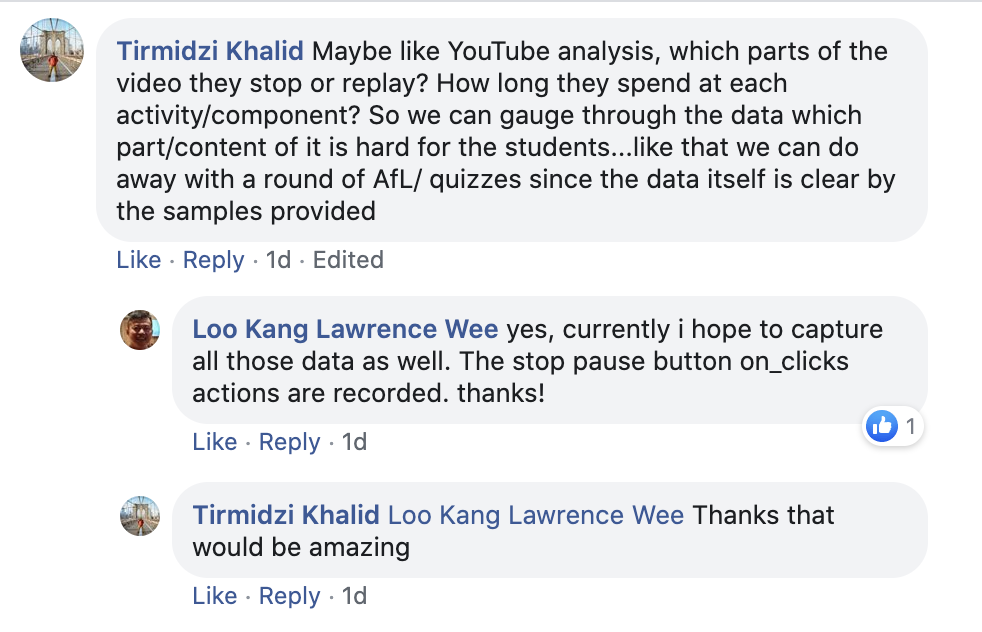
Figure 1: Sample screenshot of a SGLDC discussion on whether there is a need for such data analytics from simulations, suggesting there is demand for such features
This study would provide evidence for teachers who often wonder how their students are coping with the assigned simulation activity, what is their degree of proficiency, and whether students need guidance when they face difficulty during Home Based Learning (HBL). Literature on clickstream and game-based assessment research also supports ELEs to be able to provide insights into student understanding and misconceptions.
A teacher dashboard for data analytics visualization and filtering of students’ actions of the online ELE data will be built as an end-to-end solution. Teachers will have the ability to decide which user interactions to display or to export out for further data exploration.
Feasibility
After discussion with the SLS team, we propose developing our award winning digital library of ELE to be a Learning Tools Interoperability (LTI) tool provider so that the data collected on the ELE can be stored on a MySQL database server, and attributable to specific students. This is all done securely with OAuth signatures for validating messages between the LTI Tool Consumer (SLS) and the Tool provider (digital library of EJSS interactive/virtual laboratories). SLS will roll out its LTI enhancements by Sep 2020, thus there is a good chance that this proposal will be one of the first to test SLS’s LTI feature.
Research Method
In Chronological order.
Tool Development
The research purpose is to enrich learning and teaching practices by displaying a rich set of ELE data for better feedback and guidance through ELE/simulation data analytics. To realise this research, we need to build a LTI tool provider that serves the LTI tool consumer (SLS) through OAuth signatures validated messages.
The foundation and technical research on LTI tool provider-consumer will tap on our trainer Professor Felix to create the prototype solution and also to train project team members to contribute to the solution’s GitHub source code. The data needed for technical analytics are server logs and teachers and students usage data, expert scans on current state of LTI tool provider, LTI consumer and Oauth.
Design based Educational Research
A design based approach with an iterative cycle of development-implementation-evaluation on the technology tool, involving students and teachers is appropriate in this SSTRF.
The data needed for user research are student-user data (survey to gather feedback and areas for improvement, semi structured interviews to triangulate initial findings), teacher-user data (survey, unstructured interviews to get teachers comfortable to reveal their deep thoughts and feelings). The survey is implemented using Google forms with questions related to the research questions, and the interviews are intended to triangulate the initial findings from the survey.
Participants
Participants will be teachers from MOE-ETD’s SGLDC Facebook group, their selected students, expert consultation with MOE-HQ Senior Specialists and Master Teachers.
The sample size targeted is at least 3 teachers with at least 3 classes (online and/or face to face) of students (involving approximately 120 Upper Primary students). The choice of participants is aimed to collect enough varied ranges of responses and support iterations as new or unexpected findings may require further rounds of data collection and LTI tool and dashboard iterations.
MOE Senior Specialists will be consulted on specialist (educational technology and research)-related issues and Master Teachers on teaching-related matters.
The rationale for choice of participants is based on sample size that is sufficiently significant in the educational research context of 100. Another consideration is also not to overtax any one particular teacher so each teacher will only have to implement this in one class of 40 students.
As a pilot study, the 3 teachers X 40 students each = 120 students at the upper primary level is a manageable scope for a one year time frame.
MOE
This research serves to provide teachers with ELE simulation data, and SLS with clear visualization and student interaction data that will enable teachers to tailor for personalised instruction. This project significantly expands the capabilities of SLS without extensive development costs for building these functionalities into the core build, freeing up development for other important teacher and student features. It is estimated that a similar ELE dashboard built within SLS with front-end ELE design capabilities already in EJSS will cost upwards of \)X00K in development costs, and annual subscription of \(X0K per year in subscription costs. This SSTRF of \)XXK and annual subscription of \(XX0, it is an upfront cost saving of 66% and the SSTRF approach leverages on the experts in the Open Source Physics community with higher chance of sustainability and adoption (Table 1).
|
SSTRF |
SLS build |
|
|
Upfront development cost |
\) XX,000 or less |
\(X00,000 or more |
|
Subscription per year |
\)XX0 for web server and domain name \(0 for any number of students |
\) X0,000 or more based on the number of students in SLS. |
|
Sustainability |
Open Source Physics (OSP) community who upgrades the system usually for free or other research grants |
SLS vendor with upgrades costly charges |
|
Scope of PI |
PI is a senior specialist who specialises in ELE with deep expertise and part of the network of OSP. Therefore, to build this is a natural extension of the existing body of work in the web server and integrate with SLS. |
PI is not in the SLS team, and therefore cannot influence the SLS build components, which is already full until 2024. |
|
Consultation with SLS team members |
SLS team suggested that this tool be built via the SSTRF approach and be integrated to SLS via the LTI standards. |
SLS team suggested it is difficult to do this as a SLS component due to cost and sustainability concerns. |
Table 1: Comparison of SSTRF and SLS component build with compelling reasons for support this SSTRF
To be even more compelling to develop this SSTRF, this approach is aligned with SLS’s LTI plan to communicate with external systems through adoption of LTI standards, collecting and sending encrypted learning data-information through the internet with external systems.
The research team will also present interim findings and progress reports to the SLS Steering Committee in Jun 2021 and final updates in Oct 2021.
ETD
As Artificial intelligence and Data Science is one of the Research Groups within ETD X-Labs (specialist wing supporting the division), this research serves as one of the pillar Senior Specialist projects to push the boundary of Data Analytics, complementing commercial tools technology-literature scans done by AI section of ETD. Iterative dashboard design with teachers and students will allow us to understand useful and reliable ELEs, as well as build capabilities among teachers and specialists to design assessment items that better assess user understanding and behaviors. Data gathered over time are stored within EJSS, can provide a rich database to train AI assessment engines that can map user interactions to learning mastery. Our 2030 vision is to create a consistent and rich database enabled to train AI assessment engines, specifically, based on Machine Learning (ML). For example, a ML method can use our database as a training dataset in order to generate a prediction model.
The project also can provide alternative assessment methods that can plug into MOE’s AI Adaptive Learning System (ALS), a thread under the MOE AI Use Case. The training provided by our trainer will also level up the team’s expertise and our trainer can also give talks to all specialists and MOE officers in the area of data science.
Teachers
No longer a black box for teachers who assign simulations as home based learning tasks, teachers can view and evaluate individuals as well as group data on particular simulation tasks (Figure 2).
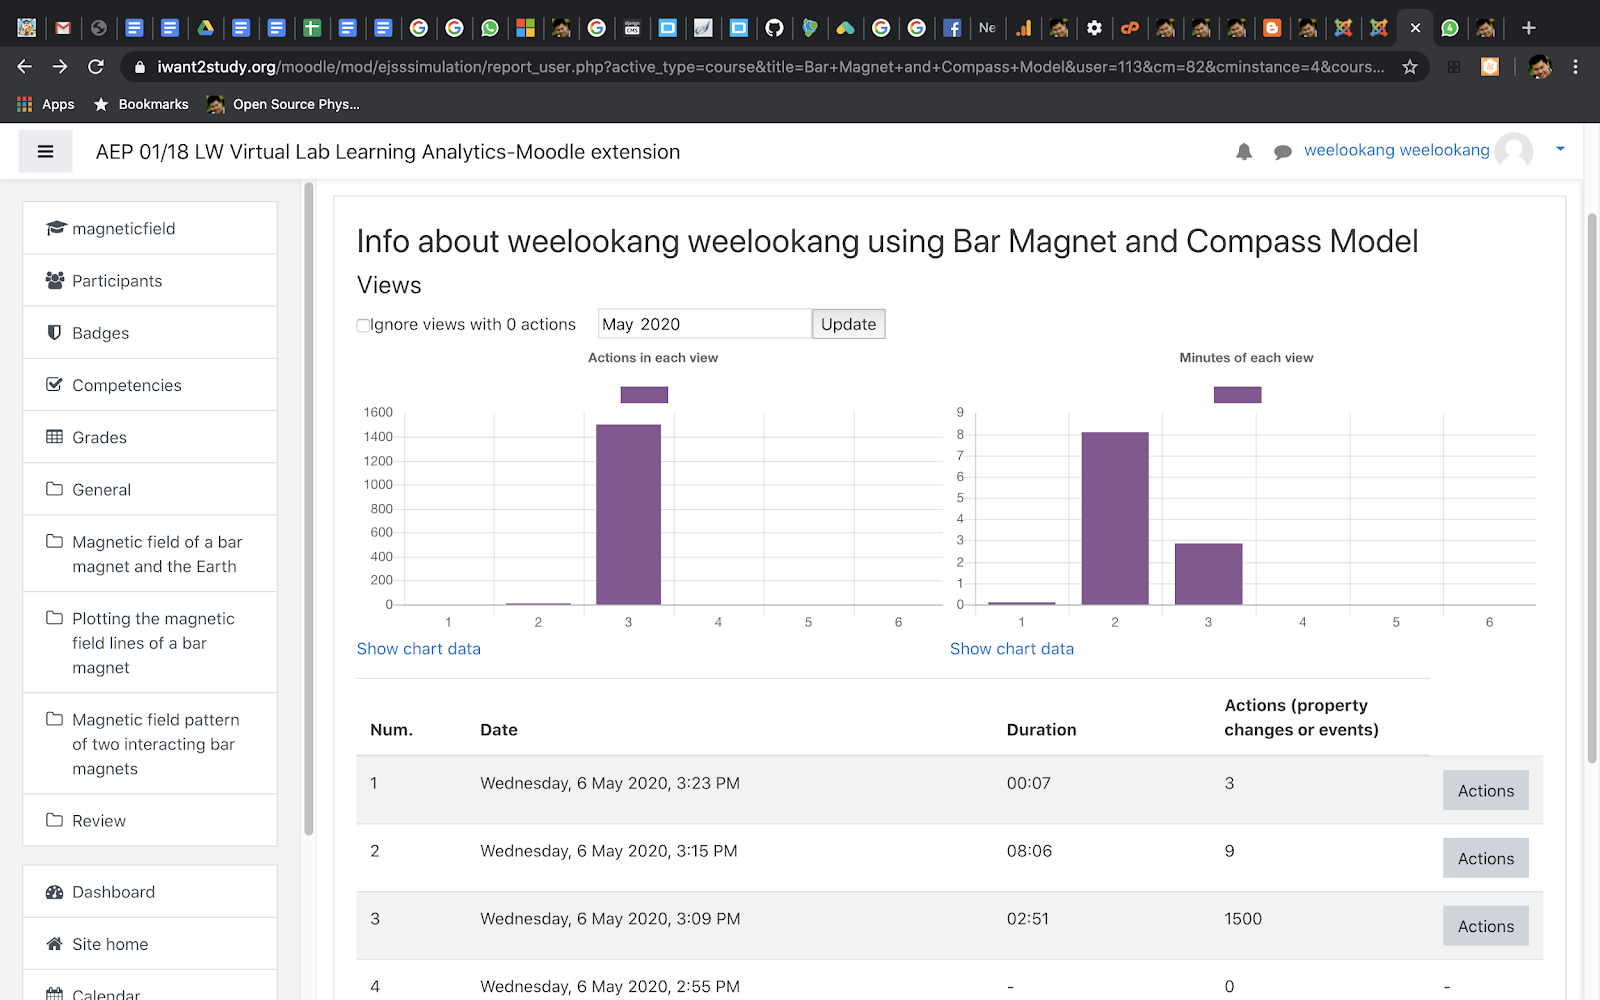
Figure 2: A possible teacher dashboard visualization of students log of actions using a particular simulation showing Date, Duration and Actions
Data collection approach
Simulations or ELE will collect any event in the student’s browser such as button clicks, slider drags, combo-box selection, drag on plotting panel objects with position and time data are captured. This approach is well-known like Clickstream analysis. These clickstream data will be sent to an external database where different Learning Analytics (LA) indicators will be calculated.
Specific learning analytics indicators/dimensions and how they will help with teaching and learning
We will focus on LA indicators (Table 2) that are useful for knowing the student’s thought, behavior and engagement.
|
LA indicators |
Data collected |
|
Related to student’s thought process |
|
|
Related to student’s behavior |
|
|
Related to student’s engagement |
|
Table 2: Specific learning analytics indicators/dimensions and how they will help with teaching and learning
For example, if the student takes unnecessary simulation steps to get to the desire state, it shows the student’s thought process (see Figure 4 to 8)
When such data-driven evidence is presented to teachers, they will be in a better position to design remediation strategies and provide personalised feedback. Therefore, we hope our Learning Analytics tools (Table 3) can provide teachers with valuable insights of student engagement and learning. The teacher can use those insights to make decisions, change learning processes, and adapt learning contents (Figure 3).
|
LA system |
type of data and how it works |
|
Real-time feedback system |
clickstream data is collected in real-time and sent to an external database. The LA indicators are calculated and generated in real-time as well. When new LA indicators are available, they are shown in the Dashboard view |
|
Student behavior analytics tool |
This tool is in charge of generating LA indicators related to student’s behavior. It uses any new clickstream data to update student’s behavior indicators in real-time. |
|
Student engagement classifier |
Similarly to student behavior analytics tool, this tool generates the student’s engagement indicators. |
|
Student performance predictor |
This tool uses the LA indicators, in particular the student’s thought process indicators, to predict the student’s performance |
Table 3: Types of LA system and the type of data and how it works
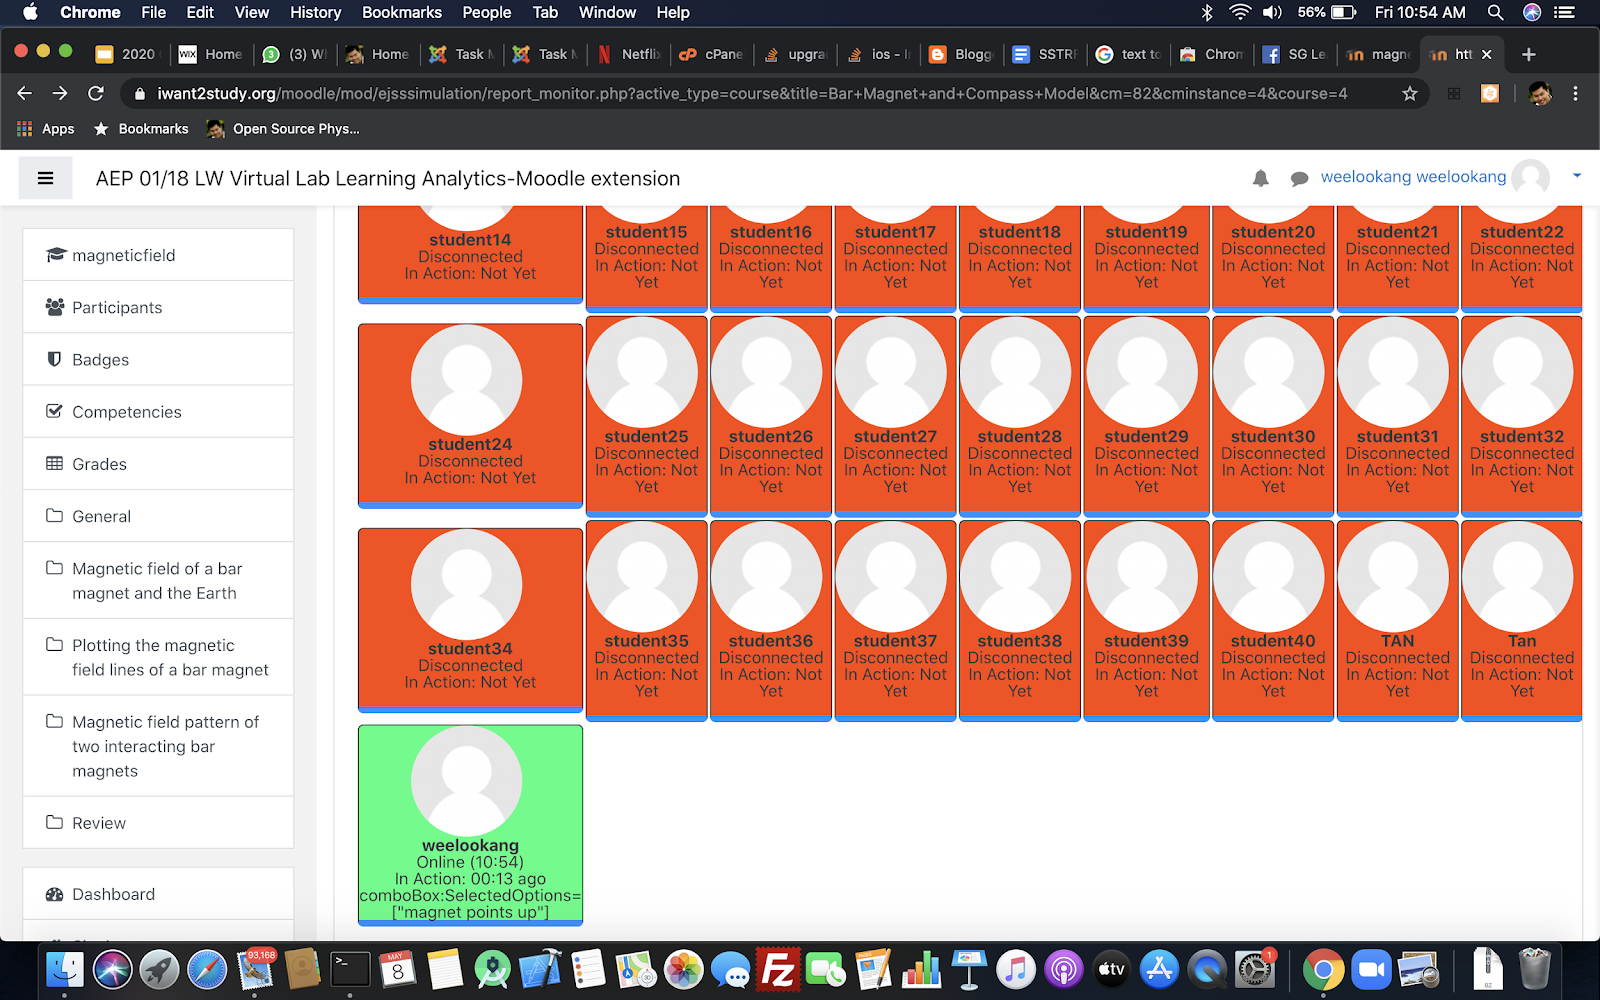
Figure 3: Screenshot of a possible real time teacher dashboard, showing students who are online or offline and what are their last 3 actions, that can help the teacher conduct live simulation demonstration, adapt the teaching content and get students to follow the steps as guided by the teacher
Students
Students are ultimately the recipients of all the enhanced strategies and feedback that can be harnessed from data. They will benefit from a more data driven ecosystem of SLS and LTI providers.
For example, in a kinematics mathematical modeling lesson, the student may choose to type in the model, ”X=0” as an equation that represents the motion of the simulated car when it is stationary (Figure 4).
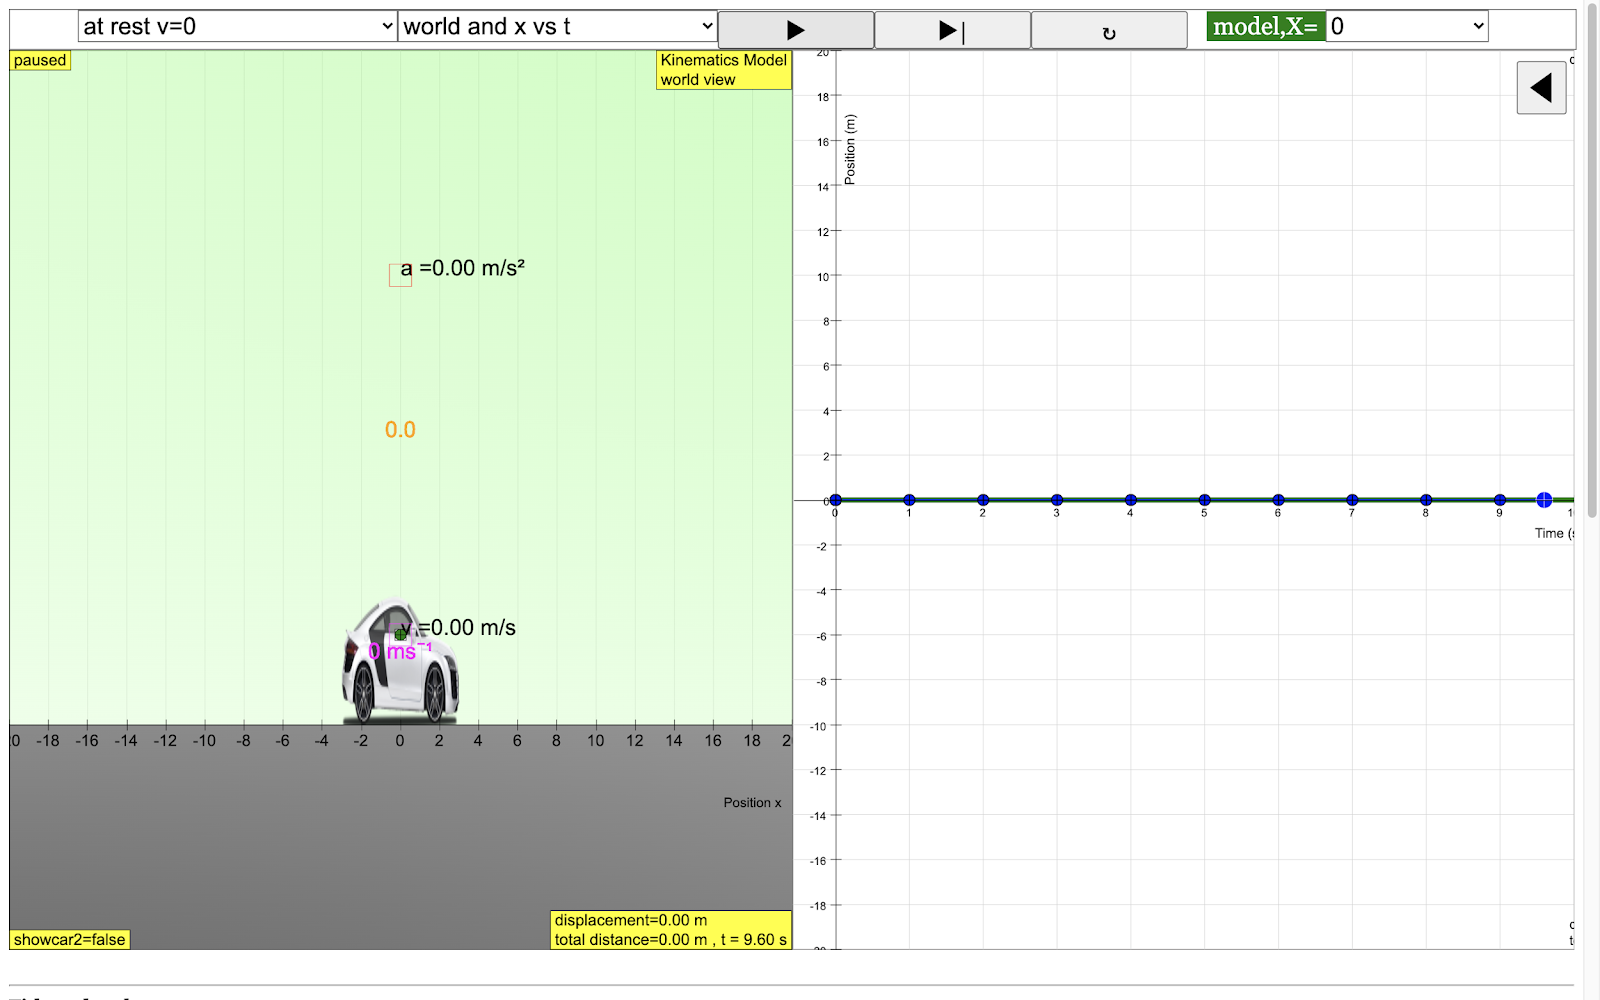
Figure 4: Screenshot of simulation of a car on the left and the plot of position versus time on the right. The simulated motion is a stationary car and the student needs to use an equation to describe the motion via the combo box on the top right corner of model, X=0
What if the motion is now uniform with velocity at 2 m/s (Figure 5) and the student may select the model, “X = t” as an equation that can represent the motion of the simulated car. This first inaccurate selection is evidence of incorrect conceptual understanding.
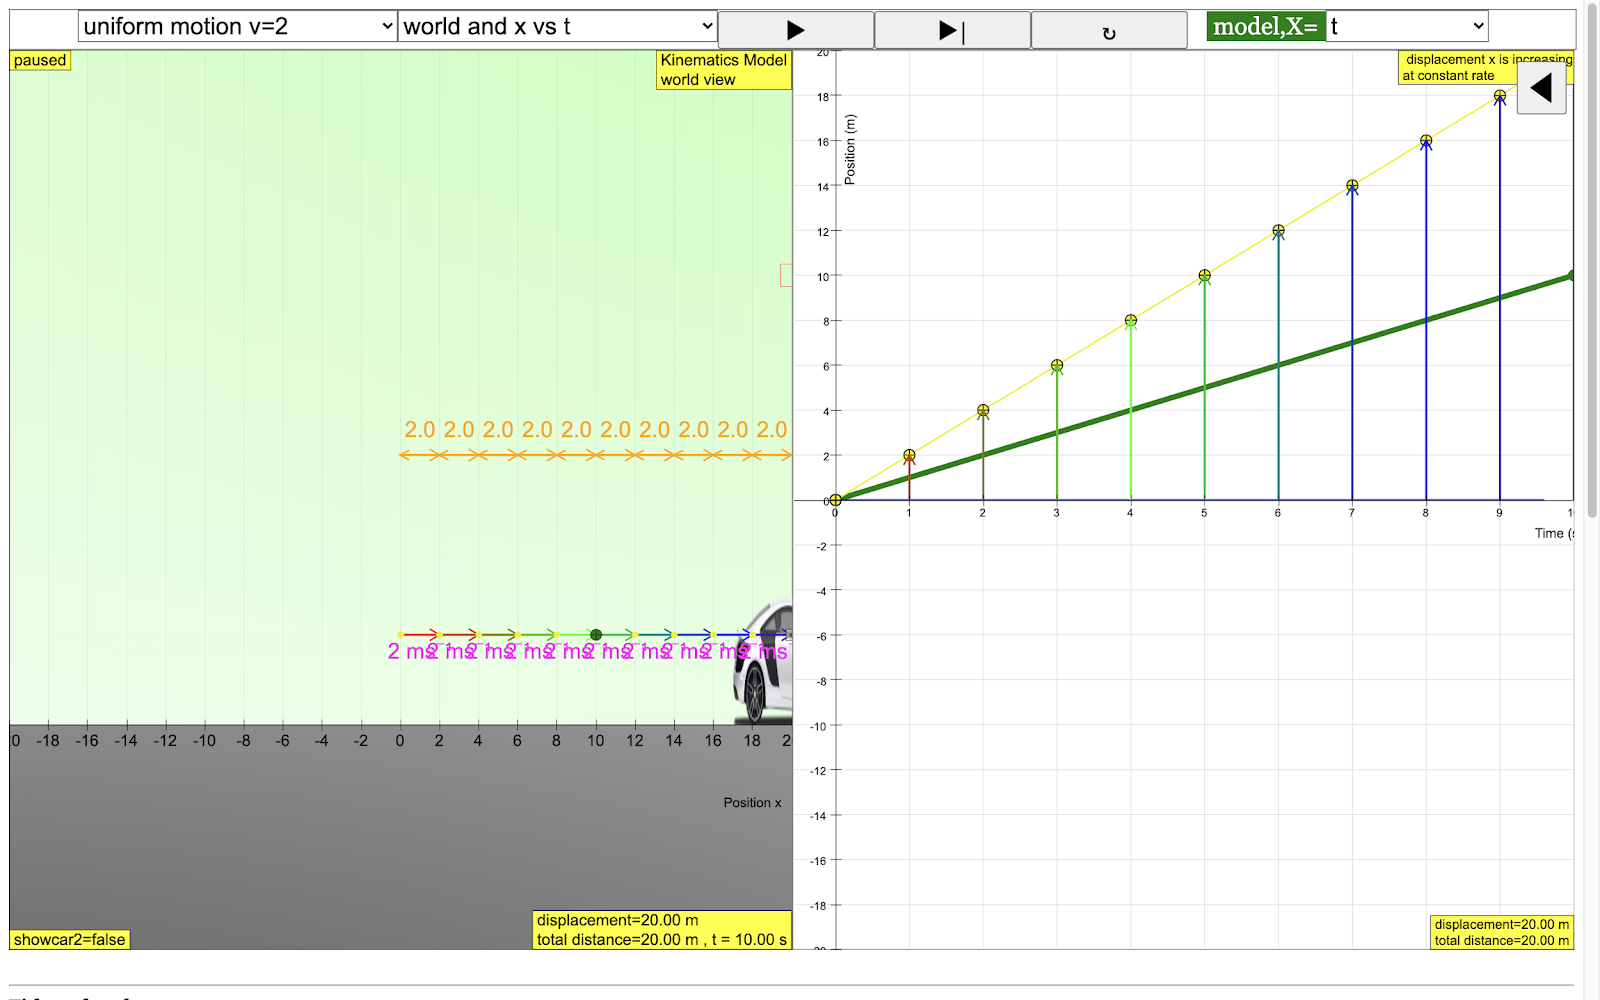
Figure 5: Screenshot of simulation of a car on the left and the plot of position versus time on the right. The simulated motion is a uniform motion velocity of 2 m/s car and the student could have used the model, X=t to predict the motion inaccurately.
If the student continues to choose incorrect equations, say X= -t (Figure 6) it could mean that the student doesn’t have the concept of kinematics equations and the meaning of the coefficient v which is velocity, of the equation X = v*t for simple constant velocity motion.
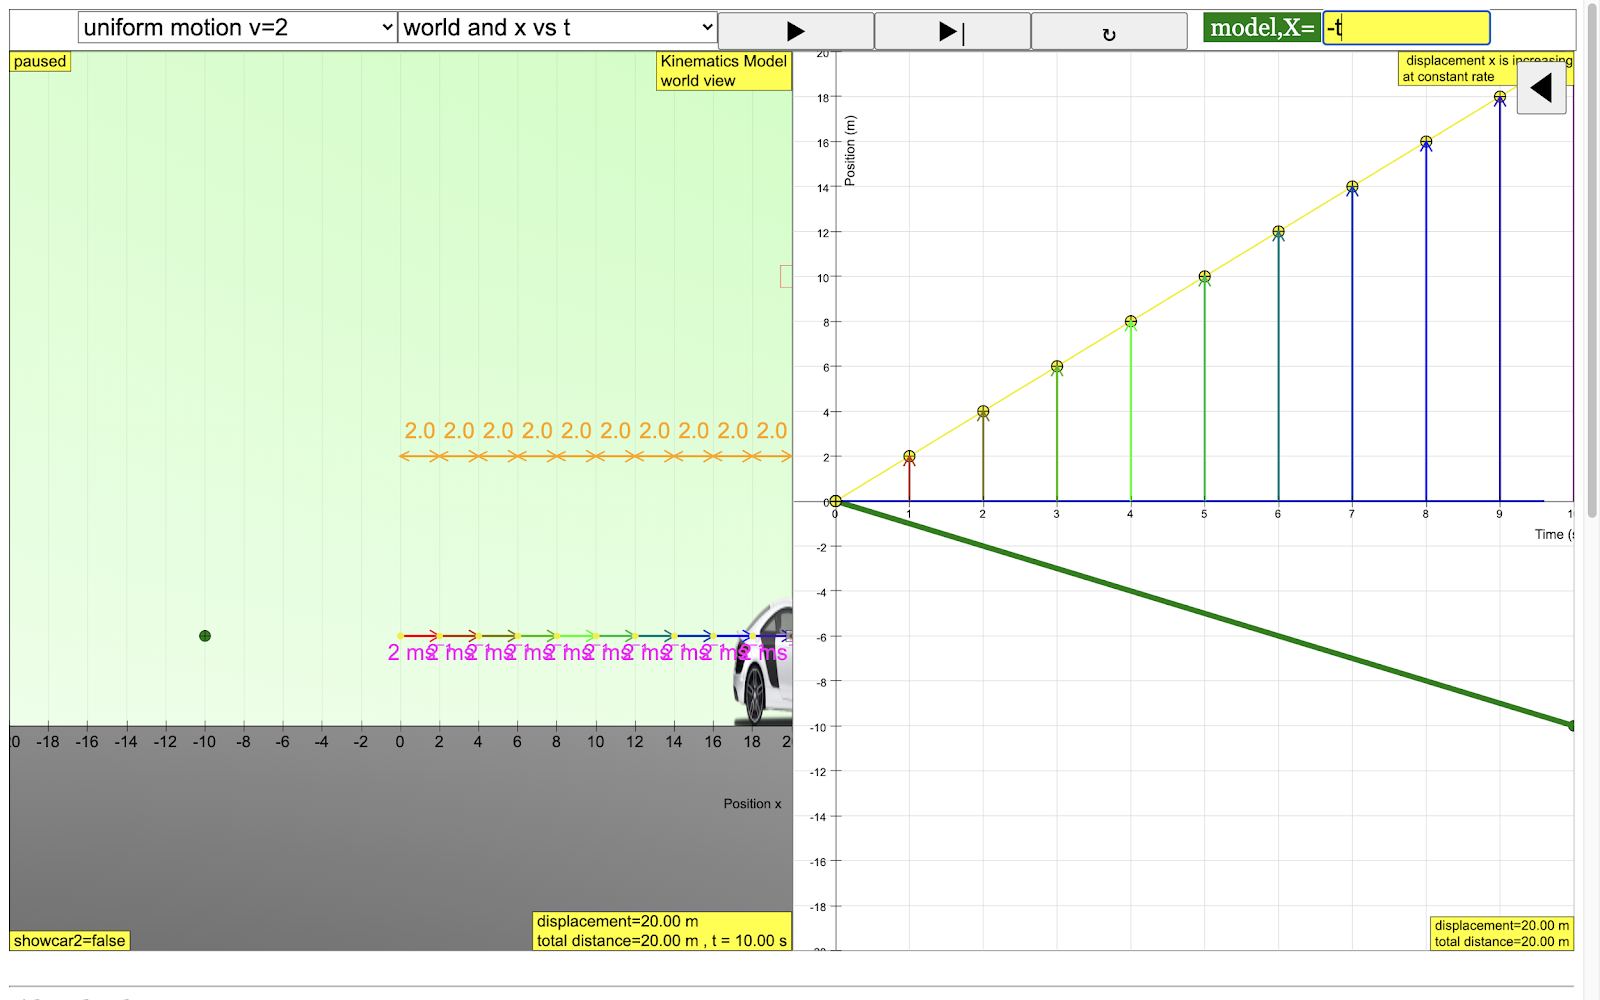
Figure 6: Screenshot of simulation of a car on the left and the plot of position versus time on the right. The simulated motion is a uniform motion velocity of 2 m/s car and the student’s second attempt is the model, X=-t, to predict the motion inaccurately again
In addition, the choice of inaccurate equations say X = sin(t) (Figure 7) or any progressively closer fit equations to model the simulation’s car motion will all be captured and analysed, to provide teachers with indicators of student’s thought, behavior and engagement.
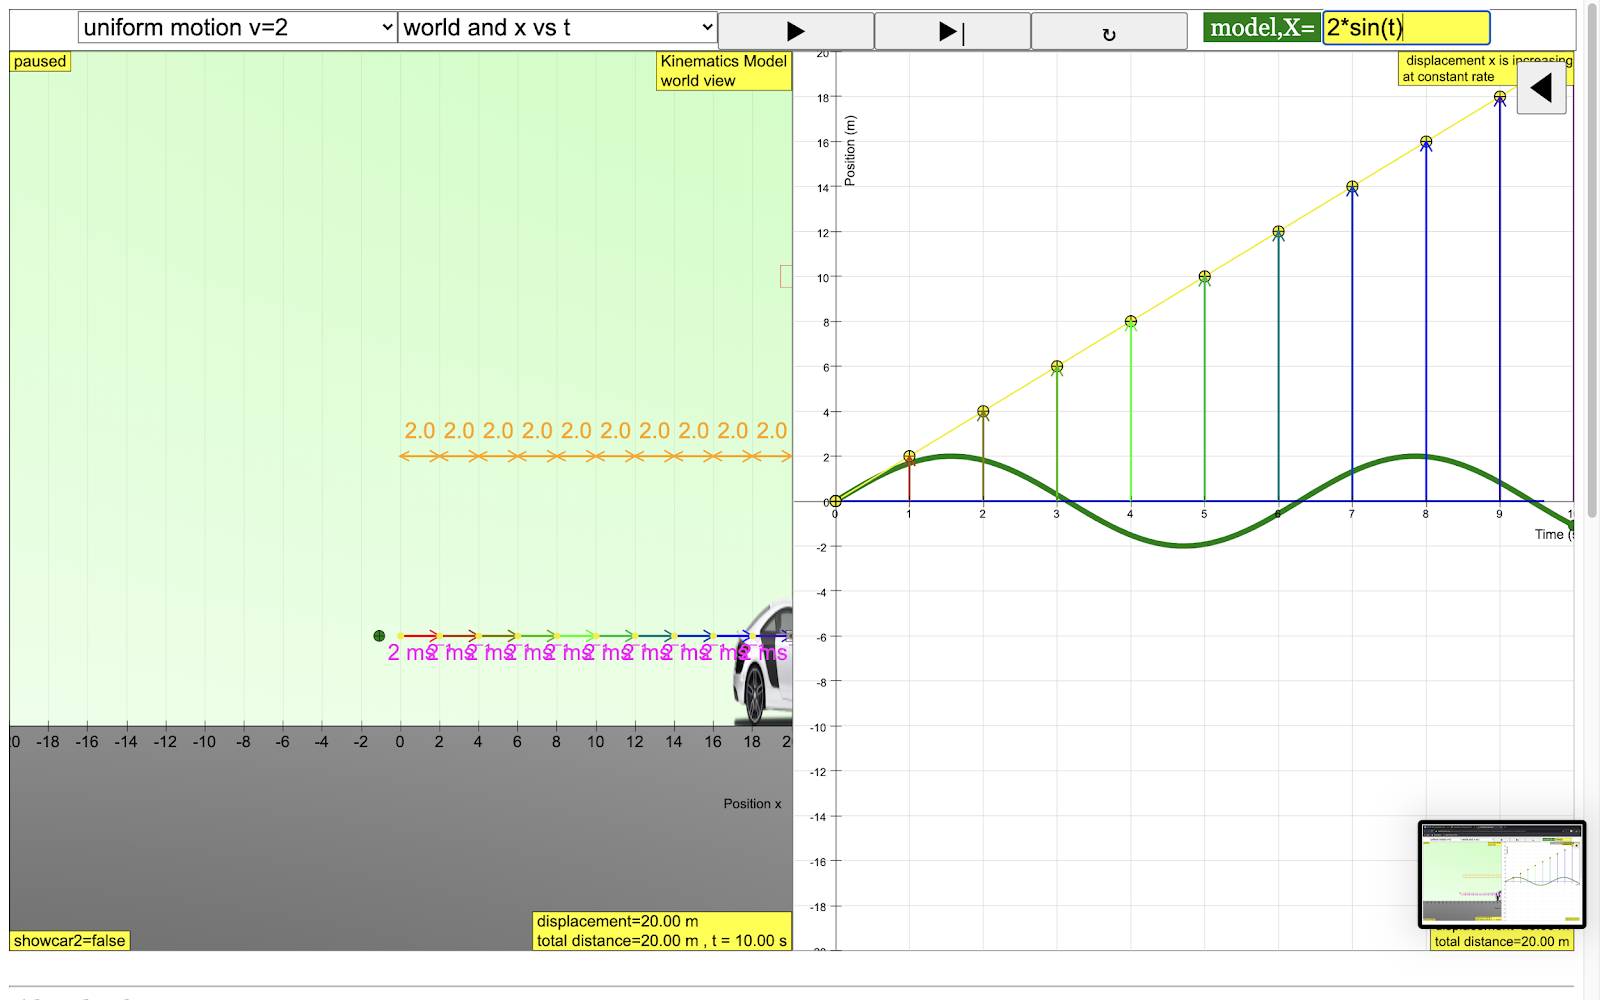
Figure 7: Screenshot of simulation of a car on the left and the plot of position versus time on the right. The simulated motion is a uniform motion velocity of 2 m/s car and the student’s third attempt is the model, X=sin(t) to predict the motion inaccurately again
Ideally, when the student gets the correct answer of X = 2*t (Figure 8), it is a clear indication of the student’s iteratively stronger understanding of mathematical models to describe uniform velocity at 2 m/s motion of a car.
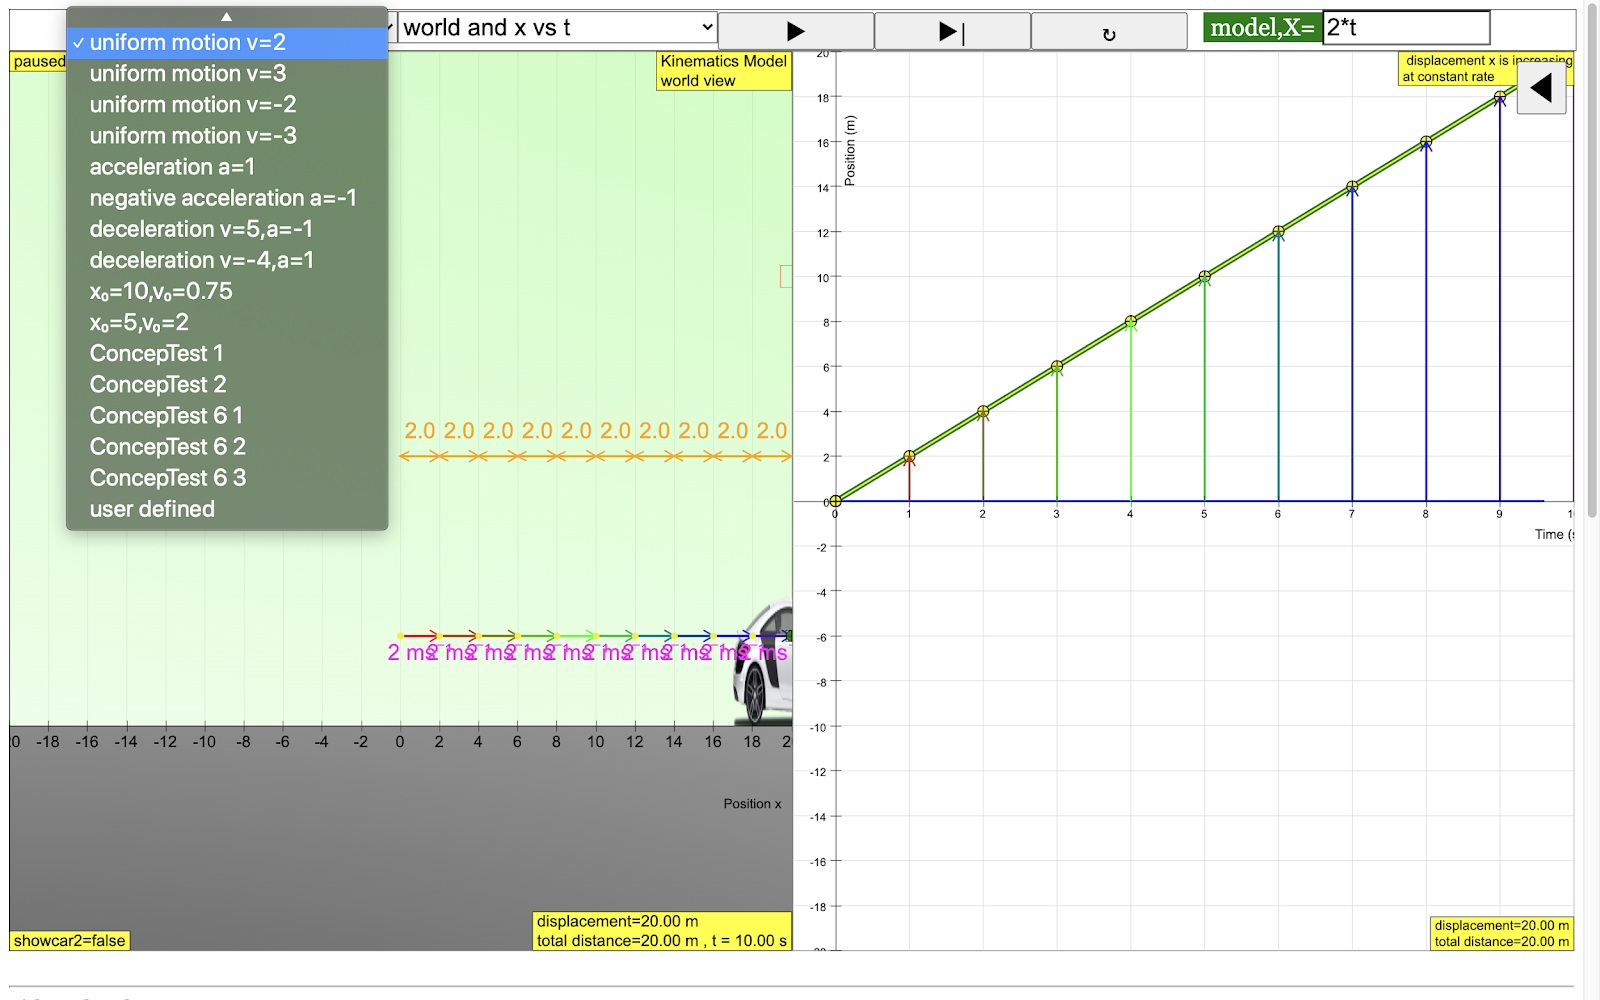
Figure 8: Screenshot of a range of curriculum learning scenarios. The simulated motion is a uniform motion velocity of 2 m/s car and the student’s ideal attempt of the model, X=2*t to predict the motion accurately. Here, we are not looking for the correct model immediately but rather the struggle and repeatability of correctly using equations to predict motions in the curriculum
We speculate these data will benefit students tremendously when their teachers are provided with evidence-information on the student’s progressive modeling technique using equations as the sequence of data capture, that is an indication of the understanding and thinking behind those progressively better model- equations.
In addition, these user interactions can be compared with expected interactions in order to classify students according to their activity performance and teachers can ‘predict’ the performance of students.
With all the data from a learning experience safely stored, aggregated, and organized, it becomes possible to take full advantage of a learning analytics platform. Useful LA tools for teachers are such as real-time feedback system, student behavior analytics tool, student engagement classifier and student performance predictor provide teachers with insights and can address gaps in students’ conceptual understanding.
Data collected for teachers decision making and student learning
|
Data collected |
Rationale to inform teacher |
Possible layout |
|
online/offline |
quick check if students are on the correct ELE, can assist the teacher to identify students who are not on tasks. |
|
|
last 2 actions |
for synchronous classroom actions and coordination if the teacher wants to guide students step by step on the ELE, can assist the teacher to identify students who are not on tasks. |
|
|
all events and action activity log on |
to allow teacher to review actions the students probably via a video player format or selectable filter such as “Element” and “Property” instead of table text form |
|
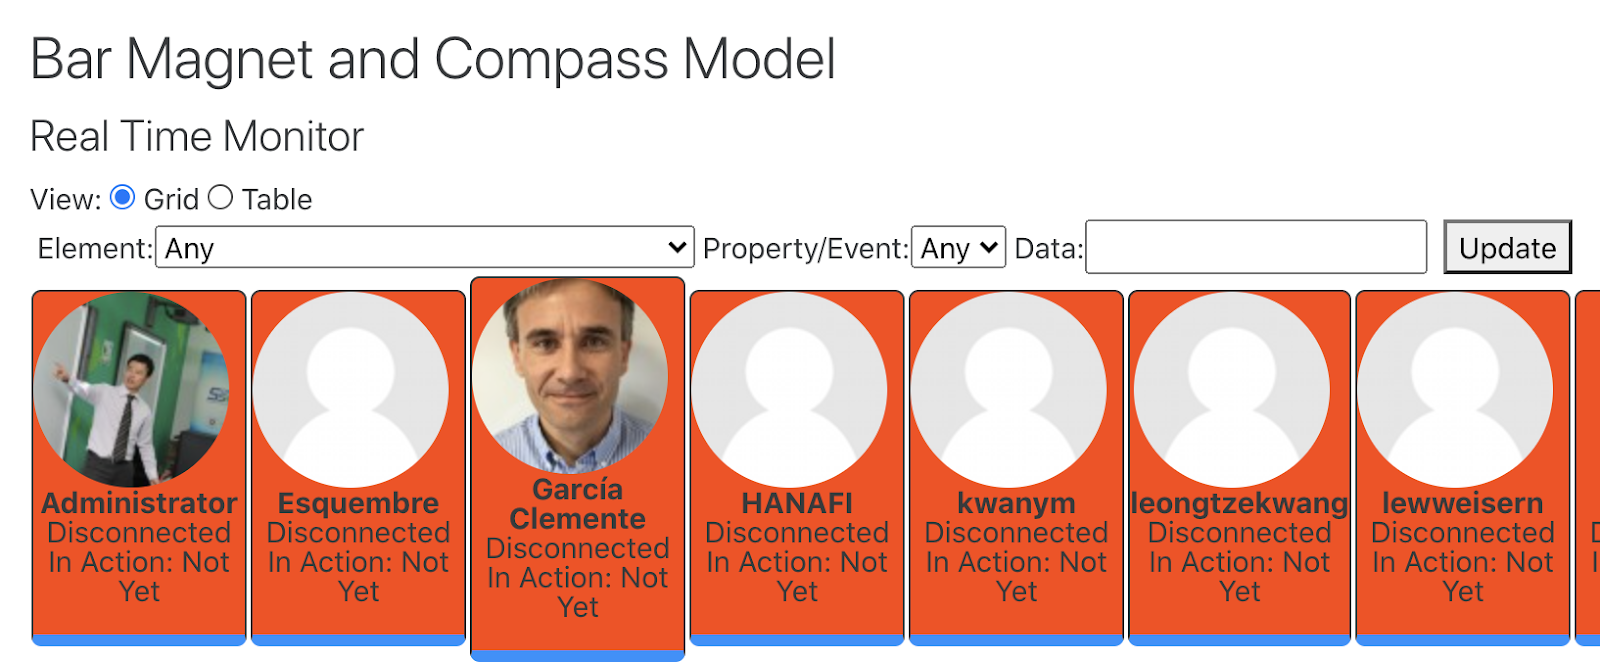

Table 2: kind of data to be collected, the rationale to inform the teacher and a possible layout of the display inside SLS and the web server hosting all the ELE.
Wider Open Education Community
MOE has expressed interest in the past to contribute to the open education community and EJSS is already an internationally recognised platform for designing learning with ELE. This LTI compliant learning tool data analytics feature will make EJSS able to plug into all LTI compliant LMSs benefiting all communities of EJSS users, and even accelerate research in clickstream and game-based assessment.
Is the solution scalable?
In the future, the LA dashboard could incorporate new functionalities such as decision-making support, clustering, and others to make easier teaching tasks.
We consider that our architecture is scalable because it is based on well-known technologies (LTI, web technologies, etc.) and, therefore further ML-based functionalities built over our system will be scalable as well. For example, in principle, other HTML5 games like those SLS team surfaced from other Institutes of Higher Learning (IHL) projects will need to incorporate the EJSS API (to be built in this proposal) in order to enjoy the same level of data collection approach for analytics in SLS.
Choice of ‘Trainer’
When the SSTRF runs into troubles with the deliverables, the project team will naturally have to ask Professor Felix for his help as he knows precisely what he has done in his 7 years maintaining and developing the EJSS authoring toolkit. It is naive to believe that someone else is willing and able to continue to build on Professor Felix's work without Professor Felix advice and wisdom.
Trainer’s CV
Felix J. Garcia-Clemente is Associate Professor at the Department of Computer Engineering of the University of Murcia (Spain). His research interests focus on Educational Technologies (edtech) and Learning Analytics (LA), and he specializes in applying data science to simulation-based online courses to enhance human knowledge on how we learn. He is co-author of over 100 scientific publications (including journal and conference papers) and an active member on different national and international research projects.
In relation with edtech, he participates on the following active projects:
Learning analytics and game based assessment (LAGA). Massachusetts Institute of Technology (MIT).
iLabs Digital Laboratory Twins. Stanford University.
Indra Cyber Range. Indra Sistemas (Spain).
And his last publications focused on edtech are:
Luis de la Torre, Lars Thorben Neustock, George Herring, Jesus Chacon, Felix J. Garcia, Lambertus Hesselink, “Automatic Generation and Easy Deployment of Digitized Laboratories”, IEEE Transactions on Industrial Informatics, vol. 16(12), pp. 7328-7337, 2020.
Alberto Huertas Celdran, Felix J. Garcia Clemente, Jacobo Saenz, Luis de la Torre, Christophe Salzmann, Denis Gillet, “Self-Organized Laboratories for Smart Campus”, IEEE Transactions on Learning Technologies (TLT), vol. 13, no. 2, pp. 404-416, 2020.
Alberto Huertas Celdrán, José A. Ruipérez-Valiente, Félix J. García Clemente, Maria Jesus Rodriguez Triana, Shashi Kant Shankar, Gregorio Martínez Pérez, “A Scalable Architecture for the Dynamic Deployment of Multimodal Learning Analytics Applications in Smart Classrooms”, Sensors, vol. 10, no. 10, art-no. 2923, 2020.
Felix is a co author of Easy JavaScript Simulations (EjsS) and a collaborator in the Open Source Physics (OSP) project and Open Source Physics@Singapore. As a member of the OSP Team, he received the Excellence in Physics Education Award from American Physical Society (APS). Felix was a visiting scholar at the research group Coordination & Interaction Systems (REACT) of the EPFL School of Engineering (Switzerland), the National Institute of Education (NIE) of NTU (Singapore) and the Ginzton Lab of Stanford University (USA).
Financial Compliance
As Professor Felix is the main leader in the Open Source Physics community who created the authoring toolkit called Easy JavaScript Simulation, there is no one else who knows how to modify the authoring toolkit to achieve the goals of this SSTRF quickly and efficiently for future adds-on. He is also a Data Analytics and Computer Science professor who can help develop the features and train the members of the SSTRF team with the necessary skills for the successful completion of this SSTRF. My conversation with ETD SSTRF Finance controller suggests this is in compliance with financial matters in MOE as Professor Felix is the only professor capable of delivering this SSTRF goals.
Return of Investment
Even though \(X0 000 is budgeted as Professor Felix’s visitation to Singapore to ‘train’ the project team members, we can easily scale the training to other interested SS who want to learn from Professor Felix to make the cost per head lower. The prerequisites are a strong interest in coding and a strong desire to create new content using EJSS authoring toolkit with the training received. Both Lawrence WEE and Darren TAN are past trainees of Professor Felix MOE-NIE edulab funded workshops and are most willing to continue training for other SS. This will lower the cost of training by many folds again. But the important question to ask is, is the training useful rather than how low is it per person?
The project team’s 900+ simulations received 4000 users per month from Singapore and 30000 users per month in the world and it is argued that return of investment needs to dig deeper into the impact of the funding such as in terms of usage in SLS and the world. With the SSTRF proposed deliverables, the number of users will likely trend up as we intend to provide tight integration into SLS as well (this can only happen if the proposal is funded) as make the 900+ and growing number of simulations with data analytics, something not achieved by any other Ministry of Education. Professor Felix can also conduct training and sharings to all interested including Master Teachers and Specialists on his work as well as the proposal’s deliveries.
I recommend for the very interested SS, to contact Lawrence WEE to join the proposal formally as a team member to legitimise the training, form good working relationships and contribute more sustainably beyond the funding period of this SSTRF.
Contingency plans
To answer the question if the trainer is not able to come to Singapore, we will move to online training via Zoom (discussions and meetings) and Microsoft Remote Desktop(technical support).
Extension of the training to other SS/officers
We will extend the invitation all SS and HQ officers to schedule 2 half days per week for clinics sessions(face to face or Zoom and Remote Desktop), where officers can get targeted training (advice and support) with the related data analytics or Easy Javascript Simulation issues and problems they need help in solving. This aims to ensure the trainer gets to help officers get their skills up and solve real problems over a longer 8 week period (4 weeks, SSTRF2020 and 2 weeks SSTRF2021 combined) with consultation and training.
Exploration
My position is to continue with SSTRF2021 as I am a SS trying to do work legitimately that can benefit SLS through simulation Data Analytics, it is a new area that SLS Assistant Product Owner (SLSAPO) spoke to me about pursuing under SS funds, instead of SLS build due to high build and high maintenance cost if done by a vendor.
COVID-19 cause my SSTRF2020 (SLS e-assessment interactive) and SSTRF2021(SLS interactive data analytics ) to use the trainer funds in the same year in 2021, thus it is not possible to conceptualise these 2 SSTRF as one engagement as SSTRF2020 was due to my involvement with SEAB-MOE electronic school based assessment (e-SBA) task force and SSTRF2021 was due to ETD's X-lab data analytics thrust.
I agree with SLSAPO that if I use my expertise and community (Prof Felix in particular) it will likely be more sustainable (open source physics professors will look into it and improve the technology over time) and cost effective
Greater financial prudence is already achieved by doing such a difficult data analytics project with \)X0,000, estimated at $X00,000 for SLS vendor build, and the high yearly maintenance. If Professor Felix can finish these two SSTRF20 and SSTRF21
In 2022 if it is assesses that there is something that needs Prof Felix computer science skills, then we try to explore funds to pay for training, with a focus to level up colleagues in technical know how (Artificial intelligence, Data Science, Computer Modelling).
|
Milestones |
Month |
|||||||||||
|
Jan |
Feb |
Mar |
Apr |
May |
Jun |
Jul |
Aug |
Sep |
Oct |
Nov |
Dec |
|
|
literature scan of LTI provider, SLS discussion and syncing information and chart way forward |
||||||||||||
|
Develop a basic prototype LTI tool provider, assist in LTI tool provider scripting and Oauth of simulations to a LTI tool consumer (SLS) |
||||||||||||
|
To design the teacher dashboard interface integrative into SLS using carbon design framework and conduct research on user interface and experience by RA2 |
||||||||||||
|
Design the ELE lessons with 5 SGLDC teachers, with survey and interview items protocol developed |
||||||||||||
|
Improve LTI tool provider and Oauth surface by the project team and sync up with SLS |
||||||||||||
|
Prepare second round of ELE lesson with teachers |
||||||||||||
|
Prepare report and prepare for journal paper publication to share answers/knowledge to inform learning and teaching in wider settings |
||||||||||||
Job
- To design the simulations, assist in LTI tool provider scripting, survey and interview questions and data sense making, discussion with experts and reporting writing.
- To design the teacher dashboard interface integrative into SLS using carbon design framework and conduct research on user interface and experience. This is suggested by the SLS team as the teacher dashboard ideally needs to be polished and made using the same framework, sitting inside SLS for scalability.
Trainer
- To train the team members in the design and development of
- ELE design for authentic and meaningful teaching and learning
- LTI tool provider-consumer-Oauth framework
- Customize EJSS editor (Prof felix is the creator) to work in the LTI tool framework and eventually communicate with SLS through LTI standards.
https://weelookang.blogspot.com/2021/01/2021-senior-specialist-track-research.html